19.| Crime Rate: FBI A random sample of n, gave the following violent crime rates (per x,: New England Crime Rate 3.5 3.7 4.0 3.9 3.3 Another random sample of n, = 12 regions gave the following violent crime rates (per x,: Rocky Mountain States 3.7 4.3 4.5 5.3 3.3 4.8 3 (Reference: Crime in the United States, Fec Assume that the crime rate distribution is a regions. i. Use a calculator to verify that I S2 = 0.94. 11. Do the data indicate that the violent cri region is higher than that in New Engla 20. | Medical: Hay Feyer A random sample of


Unitary Method
The word “unitary” comes from the word “unit”, which means a single and complete entity. In this method, we find the value of a unit product from the given number of products, and then we solve for the other number of products.
Speed, Time, and Distance
Imagine you and 3 of your friends are planning to go to the playground at 6 in the evening. Your house is one mile away from the playground and one of your friends named Jim must start at 5 pm to reach the playground by walk. The other two friends are 3 miles away.
Profit and Loss
The amount earned or lost on the sale of one or more items is referred to as the profit or loss on that item.
Units and Measurements
Measurements and comparisons are the foundation of science and engineering. We, therefore, need rules that tell us how things are measured and compared. For these measurements and comparisons, we perform certain experiments, and we will need the experiments to set up the devices.
#19
![**Crime Rate: FBI**
1. A random sample of \( n_1 = 10 \) regions in New England gave the following violent crime rates (per million population):
\[
\bar{x}_1: 3.1, 2.9, 4.8, 1.8, 4.1, 2.8, 3.1, 2.9, 4.8, 1.8
\]
i. Use a calculator to verify that \( \bar{x}_1 \approx 3.51 \), \( s_1 \approx 0.94 \).
ii. Does this data indicate that the violent crime rate in the Rocky Mountain region is higher than in New England? Use \( \alpha = 0.01 \).
2. Another random sample of \( n_2 = 12 \) regions in the Rocky Mountain states gave the following violent crime rates (per million population):
\[
\bar{x}_2: 3.5, 3.7, 4.0, 3.9, 3.3, 3.3, 4.3, 4.5, 3.3, 4.8, 3.5, 2.8
\]
**Medical: Hay Fever**
1. A random sample of \( n_1 = 16 \) communities in western Kansas gave the following information for people under 25 years of age:
\[
x_1: 128, 92, 123, 112, 97, 122, 93, 112, 127, 93, 88, 128, 99, 123, 112, 97
\]
\text{Rate of hay fever per 1000 population for people under 25}
2. A random sample of \( n_2 = 14 \) regions in western Kansas gave the following information for people over 50 years old:
\[
x_2: 112, 89, 96, 90, 125, 121, 112, 110, 89, 79, 110, 95, 88, 85
\]
\text{Rate of hay fever per 1000 population for people over 50}
**Reference:** Crime in the United](/v2/_next/image?url=https%3A%2F%2Fcontent.bartleby.com%2Fqna-images%2Fquestion%2Fb59336cf-ec1d-4df0-a294-99fbbefdc623%2F5c967125-662d-44fa-9cb7-7ba0aad9b7f2%2Fi6ks0me_processed.jpeg&w=3840&q=75)
Step-by-step procedure to obtain the mean and standard deviation of New England crime rates using Ti83 calculator.
- Press STAT.
- Select Edit.
- Enter the values of New England crime rates in L1.
- Press STAT and Choose CALC.
- Select 1-Var Stats
- Press Enter.
Output obtained by Ti 83 calculator is given below:
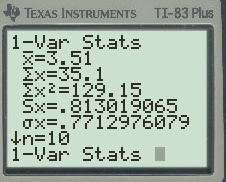
From the output, it is verified that
Step-by-step procedure to obtain the mean and standard deviation of Rocky Mountain States using Ti83 calculator.
- Press STAT.
- Select Edit.
- Enter the values of Rocky Mountain States in L1.
- Press STAT and Choose CALC.
- Select 1-Var Stats
- Press Enter.
Output obtained by Ti 83 calculator is given below:
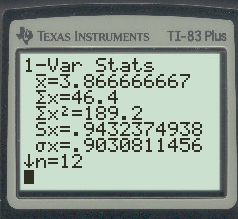
From the output, it is verified that

Step by step
Solved in 4 steps with 3 images


