18. Do the results indicate a significant difference between blood pressure before and blood pressure after treatment? Use a two-tailed test with α = .05. To answer this question first find the test statistic and the critical value. Test statistic = ? Critical value = ? Reject or Retain the null hypothesis? (Enter "Reject" or "Retain") 19. For the test conducted in problem 18, compute r2 to measure the size of any effect. Indicate whether the effect size are small, medium, or large. r2 = ,? r2 is (Enter small, medium, or large): ?
Inverse Normal Distribution
The method used for finding the corresponding z-critical value in a normal distribution using the known probability is said to be an inverse normal distribution. The inverse normal distribution is a continuous probability distribution with a family of two parameters.
Mean, Median, Mode
It is a descriptive summary of a data set. It can be defined by using some of the measures. The central tendencies do not provide information regarding individual data from the dataset. However, they give a summary of the data set. The central tendency or measure of central tendency is a central or typical value for a probability distribution.
Z-Scores
A z-score is a unit of measurement used in statistics to describe the position of a raw score in terms of its distance from the mean, measured with reference to standard deviation from the mean. Z-scores are useful in statistics because they allow comparison between two scores that belong to different normal distributions.
(For Questions 17-19 and 20-24). The following data was collected from a clinical trial testing a new drug aimed to lower blood pressure for individuals older than age 45. Half of the 20 participants received the new drug (Treatment = Yes) and the other half of the participants received a placebo pill (Treatment = No). Their age and gender was also recorded. Please use this data for Questions 17-19 and 20-24 and note, not all the information in the table will be used for either problem, you must decide what is relevant based on what the problem is asking.
|
Subject ID |
Treatment |
Age |
Gender |
BP_Before |
BP_After |
|
D1 |
Yes |
65 |
F |
103.3 |
80.5 |
|
D2 |
Yes |
59 |
F |
93.6 |
85.9 |
|
D3 |
Yes |
60 |
M |
92 |
85.2 |
|
D4 |
Yes |
54 |
F |
93 |
87.8 |
|
D5 |
Yes |
65 |
F |
95.4 |
85.3 |
|
D6 |
Yes |
57 |
M |
109.6 |
94.2 |
|
D7 |
Yes |
69 |
M |
97.9 |
83.9 |
|
D8 |
Yes |
62 |
M |
96 |
85 |
|
D9 |
Yes |
49 |
F |
98.4 |
86.3 |
|
D10 |
Yes |
45 |
M |
98.4 |
90 |
|
C1 |
No |
63 |
F |
97.4 |
93.1 |
|
C2 |
No |
56 |
F |
97.2 |
92.4 |
|
C3 |
No |
54 |
M |
98.8 |
94.6 |
|
C4 |
No |
69 |
M |
98.4 |
92.3 |
|
C5 |
No |
75 |
M |
89.8 |
89.3 |
|
C6 |
No |
62 |
F |
103.4 |
99.7 |
|
C7 |
No |
61 |
F |
90.1 |
88.4 |
|
C8 |
No |
59 |
M |
93.7 |
90.4 |
|
C9 |
No |
73 |
M |
96.4 |
91.1 |
|
C10 |
No |
57 |
F |
98.6 |
90.5 |
18. Do the results indicate a significant difference between blood pressure before and blood pressure after treatment? Use a two-tailed test with α = .05. To answer this question first find the test statistic and the critical value.
Test statistic = ?
Critical value = ?
Reject or Retain the null hypothesis? (Enter "Reject" or "Retain")
19.
For the test conducted in problem 18, compute r2 to measure the size of any effect. Indicate whether the effect size are small, medium, or large.
r2 = ,?
r2 is (Enter small, medium, or large): ?
18.
Let is defined as the mean difference between blood pressure before and blood pressure after treatment. The test is that the results indicate a significant difference between blood pressure before and blood pressure after treatment. The hypothesis is,
Null hypothesis:
Alternative hypothesis:
The difference is,
| BP_Before | BP_After | Difference |
| 103.3 | 80.5 | 22.8 |
| 93.6 | 85.9 | 7.7 |
| 92 | 85.2 | 6.8 |
| 93 | 87.8 | 5.2 |
| 95.4 | 85.3 | 10.1 |
| 109.6 | 94.2 | 15.4 |
| 97.9 | 83.9 | 14 |
| 96 | 85 | 11 |
| 98.4 | 86.3 | 12.1 |
| 98.4 | 90 | 8.4 |
| 97.4 | 93.1 | 4.3 |
| 97.2 | 92.4 | 4.8 |
| 98.8 | 94.6 | 4.2 |
| 98.4 | 92.3 | 6.1 |
| 89.8 | 89.3 | 0.5 |
| 103.4 | 99.7 | 3.7 |
| 90.1 | 88.4 | 1.7 |
| 93.7 | 90.4 | 3.3 |
| 96.4 | 91.1 | 5.3 |
| 98.6 | 90.5 | 8.1 |
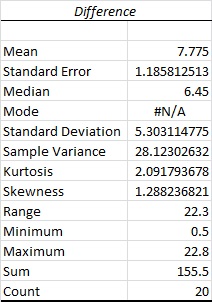
The descriptive statistics is conducted using EXCEL. The software procedure is given below:
- Enter the data.
- Select Data > Data Analysis >Descriptive Statistics> OK.
- Enter Input Range as Difference(A1:A21) column.
- Mark Labels in First Row.
- Mark Summary Statistics.
- Click OK.
The output using EXCEL is as follows:

From the output, the mean is 7.775, and the standard deviation is 5.3031.
The test statistic is,
Thus, the test statistic is 6.5568.
Step by step
Solved in 2 steps with 1 images


