18 16 14 12 10 -6 -4
Advanced Engineering Mathematics
10th Edition
ISBN:9780470458365
Author:Erwin Kreyszig
Publisher:Erwin Kreyszig
Chapter2: Second-order Linear Odes
Section: Chapter Questions
Problem 1RQ
Related questions
Question
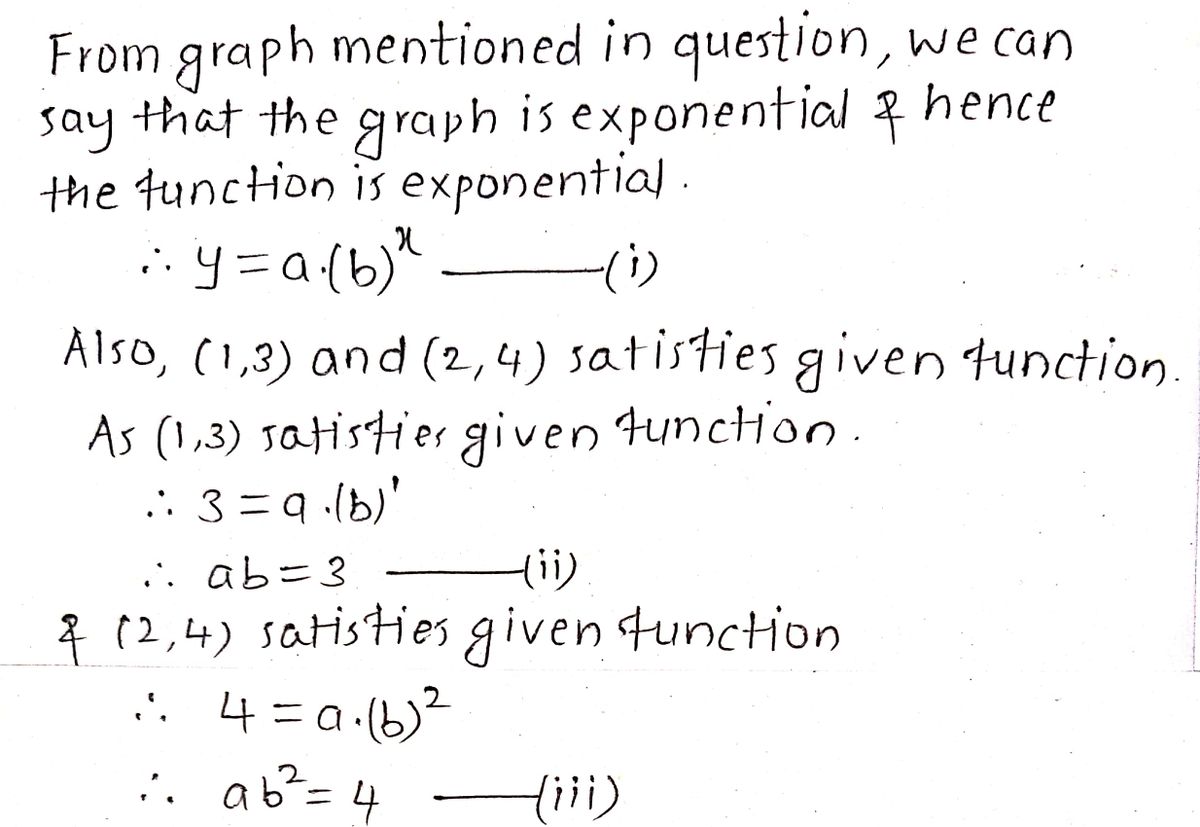
Please write the equation for the graph shown.

Transcribed Image Text:The image displays a graph of an exponential function. It features the following elements:
- **Axes**: The horizontal axis is labeled as \(x\) and the vertical axis is labeled as \(y\). Both axes have arrows indicating the positive direction. The grid helps illustrate the scale, with each line on both axes representing one unit.
- **Graph of the Function**: The red curve represents the exponential function. For values of \(x\) less than 0, the curve approaches the x-axis (but never reaches it), indicating an asymptote. As \(x\) increases, the curve rises sharply, especially after \(x = 0\).
- **Behavior**: The function passes through the point \( (0, 1) \), which is typical for exponential functions with the form \( y = a^x \). As \(x\) becomes more positive, the value of \(y\) increases rapidly.
- **Coordinates**: The curve suggests that for negative \(x\) values, the function's values are small positive numbers approaching zero, and for positive \(x\) values, the output grows significantly.
This graph serves as a representation of exponential growth, which is a key concept in mathematics, especially useful in contexts like population dynamics, finance, and natural processes.
Expert Solution
Step 1

Step by step
Solved in 2 steps with 2 images

Recommended textbooks for you

Advanced Engineering Mathematics
Advanced Math
ISBN:
9780470458365
Author:
Erwin Kreyszig
Publisher:
Wiley, John & Sons, Incorporated

Numerical Methods for Engineers
Advanced Math
ISBN:
9780073397924
Author:
Steven C. Chapra Dr., Raymond P. Canale
Publisher:
McGraw-Hill Education

Introductory Mathematics for Engineering Applicat…
Advanced Math
ISBN:
9781118141809
Author:
Nathan Klingbeil
Publisher:
WILEY

Advanced Engineering Mathematics
Advanced Math
ISBN:
9780470458365
Author:
Erwin Kreyszig
Publisher:
Wiley, John & Sons, Incorporated

Numerical Methods for Engineers
Advanced Math
ISBN:
9780073397924
Author:
Steven C. Chapra Dr., Raymond P. Canale
Publisher:
McGraw-Hill Education

Introductory Mathematics for Engineering Applicat…
Advanced Math
ISBN:
9781118141809
Author:
Nathan Klingbeil
Publisher:
WILEY

Mathematics For Machine Technology
Advanced Math
ISBN:
9781337798310
Author:
Peterson, John.
Publisher:
Cengage Learning,

