13. Use the table below to complete parts a through d. Miles Driven Gas Left in Tank (gallons) 24 10 49 22 101 18 142 15 148 14 208 a. Write a linear equation that fits the data; (hint, make equation on desmos) b. Using your line of best fit, predict the amount of gas left in the tank after driving 125 miles. с. How many miles can you drive before you run out of gas? d. Find the correlation coefficient: e. Based on your answer from part b, select the statements that would be true of this correlation. (Select ALL that apply.) O The correlation is strong. O The correlation is weak. O The correlation is positive. O The correlation is negative. O There is no correlation at all.

MATLAB: An Introduction with Applications
6th Edition
ISBN:9781119256830
Author:Amos Gilat
Publisher:Amos Gilat
Chapter1: Starting With Matlab
Section: Chapter Questions
Problem 1P
icon
Related questions
Question
13. Use the table below to complete parts a through d.
Miles Driven
Gas Left in Tank
(gallons)
10
24
49
22
101
18
142
15
148
14
208
a.
Write a linear equation that fits the data:
(hint, make equation on desmos)
b. Using your line of best fit, predict the amount of gas left in the tank after driving 125
miles.
C. How many miles can you drive before you run out of gas?
d. Find the correlation coefficient:
e. Based on your answer from part b, select the statements that would be true of this
correlation.
(Select ALL that apply.)
O The correlation is strong.
O The correlation is weak.
O The correlation is positive.
The correlation is negative.
O There is no correlation at all.
Transcribed Image Text:13. Use the table below to complete parts a through d. Miles Driven Gas Left in Tank (gallons) 10 24 49 22 101 18 142 15 148 14 208 a. Write a linear equation that fits the data: (hint, make equation on desmos) b. Using your line of best fit, predict the amount of gas left in the tank after driving 125 miles. C. How many miles can you drive before you run out of gas? d. Find the correlation coefficient: e. Based on your answer from part b, select the statements that would be true of this correlation. (Select ALL that apply.) O The correlation is strong. O The correlation is weak. O The correlation is positive. The correlation is negative. O There is no correlation at all.
Expert Solution
Step 1

Since you have posted a question with multiple sub-parts, we will solve the first three subparts for you. To get the remaining sub-parts solved please repost the complete question and mention the sub-parts to be solved.

a. The data is entered in a spreadsheet.

It assumed,

Y: Gas left in tank (dependant variable)

X: Miles driven (independent variable)

The steps to calculate simple regression are-

1) Go to ‘Data’ tab and click on ‘Data Analysis’.

2) Clicking ‘Data Analysis’, provides us with a list of Analysis tools and we select ‘Regression’.

3) From the resulting dialog box, select the respective cells for X-Range and Y-Range, select labels and click on ‘OK’. The regression table is then obtained.

The summary output obtained is-

Statistics homework question answer, step 1, image 1

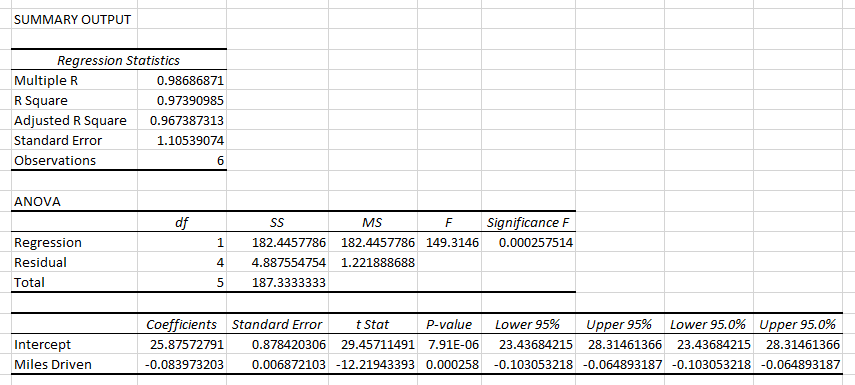
From the summary obtained the regression equation is found to be-

Y = 25.875-0.084X 

trending now

Trending now

This is a popular solution!

steps

Step by step

Solved in 2 steps with 1 images

Blurred answer
Knowledge Booster
Linear Equations
Learn more about
Need a deep-dive on the concept behind this application? Look no further. Learn more about this topic, statistics and related others by exploring similar questions and additional content below.
Similar questions
Recommended textbooks for you
MATLAB: An Introduction with Applications
Statistics
ISBN:
9781119256830
Author:
Amos Gilat
Publisher:
John Wiley & Sons Inc
Probability and Statistics for Engineering and th…
Statistics
ISBN:
9781305251809
Author:
Jay L. Devore
Publisher:
Cengage Learning
Statistics for The Behavioral Sciences (MindTap C…
Statistics
ISBN:
9781305504912
Author:
Frederick J Gravetter, Larry B. Wallnau
Publisher:
Cengage Learning
Elementary Statistics: Picturing the World (7th E…
Statistics
ISBN:
9780134683416
Author:
Ron Larson, Betsy Farber
Publisher:
PEARSON
The Basic Practice of Statistics
Statistics
ISBN:
9781319042578
Author:
David S. Moore, William I. Notz, Michael A. Fligner
Publisher:
W. H. Freeman
Introduction to the Practice of Statistics
Statistics
ISBN:
9781319013387
Author:
David S. Moore, George P. McCabe, Bruce A. Craig
Publisher:
W. H. Freeman