12. In a sample of 600 Canadians, 265 say they would rather retire in the US than in Canada. Calculate the 95% confidence interval for the true proportion of Canadians who would rather retire in the US.
12. In a sample of 600 Canadians, 265 say they would rather retire in the US than in Canada. Calculate the 95% confidence interval for the true proportion of Canadians who would rather retire in the US.

MATLAB: An Introduction with Applications
6th Edition
ISBN:9781119256830
Author:Amos Gilat
Publisher:Amos Gilat
Chapter1: Starting With Matlab
Section: Chapter Questions
Problem 1P

Related questions

Concept explainers
Equations and Inequations
Equations and inequalities describe the relationship between two mathematical expressions.
Linear Functions
A linear function can just be a constant, or it can be the constant multiplied with the variable like x or y. If the variables are of the form, x2, x1/2 or y2 it is not linear. The exponent over the variables should always be 1.
Question
100%
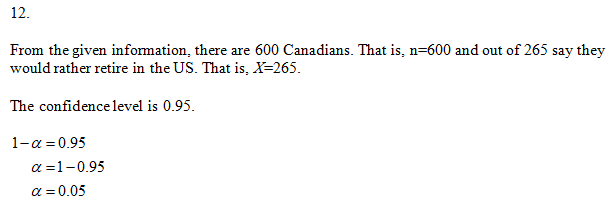
12.

Transcribed Image Text:- A Read aloud V Draw
Highlight
II. A random sampie of 30 TOur-member families visiting Disneyworld was selected, and the average
amount spent by these families on their Disneyworld visit was $825.75. The population standard
deviation is $98.25. Find the 90% confidence interval for the true population mean. Express the
interval endpoints to the nearest cent.
12. In a sample of 600 Canadians, 265 say they would rather retire in the US than in Canada. Calculate
the 95% confidence interval for the true proportion of Canadians who would rather retire in the US.
13. Use Z-scores to determine which is a better relative golf score (remember that in golf, lower scores
are better): Shooting a 75 in Tournament A where the mean score is 73 and the standard deviation is
3.4; or shooting a 76 in Tournament B where the mean score is 74 and the standard deviation is 3.6 .
Expert Solution
Step 1

Step by step
Solved in 2 steps with 2 images

Knowledge Booster


Learn more about
Need a deep-dive on the concept behind this application? Look no further. Learn more about this topic, statistics and related others by exploring similar questions and additional content below.Recommended textbooks for you
MATLAB: An Introduction with Applications
Statistics
ISBN:
9781119256830
Author:
Amos Gilat
Publisher:
John Wiley & Sons Inc

Probability and Statistics for Engineering and th…
Statistics
ISBN:
9781305251809
Author:
Jay L. Devore
Publisher:
Cengage Learning

Statistics for The Behavioral Sciences (MindTap C…
Statistics
ISBN:
9781305504912
Author:
Frederick J Gravetter, Larry B. Wallnau
Publisher:
Cengage Learning
MATLAB: An Introduction with Applications
Statistics
ISBN:
9781119256830
Author:
Amos Gilat
Publisher:
John Wiley & Sons Inc
Probability and Statistics for Engineering and th…
Statistics
ISBN:
9781305251809
Author:
Jay L. Devore
Publisher:
Cengage Learning
Statistics for The Behavioral Sciences (MindTap C…
Statistics
ISBN:
9781305504912
Author:
Frederick J Gravetter, Larry B. Wallnau
Publisher:
Cengage Learning

Elementary Statistics: Picturing the World (7th E…
Statistics
ISBN:
9780134683416
Author:
Ron Larson, Betsy Farber
Publisher:
PEARSON

The Basic Practice of Statistics
Statistics
ISBN:
9781319042578
Author:
David S. Moore, William I. Notz, Michael A. Fligner
Publisher:
W. H. Freeman

Introduction to the Practice of Statistics
Statistics
ISBN:
9781319013387
Author:
David S. Moore, George P. McCabe, Bruce A. Craig
Publisher:
W. H. Freeman