12, 18, 23, 14, 14, 16, 20, 16, 14, 16 O


Family of Curves
A family of curves is a group of curves that are each described by a parametrization in which one or more variables are parameters. In general, the parameters have more complexity on the assembly of the curve than an ordinary linear transformation. These families appear commonly in the solution of differential equations. When a constant of integration is added, it is normally modified algebraically until it no longer replicates a plain linear transformation. The order of a differential equation depends on how many uncertain variables appear in the corresponding curve. The order of the differential equation acquired is two if two unknown variables exist in an equation belonging to this family.
XZ Plane
In order to understand XZ plane, it's helpful to understand two-dimensional and three-dimensional spaces. To plot a point on a plane, two numbers are needed, and these two numbers in the plane can be represented as an ordered pair (a,b) where a and b are real numbers and a is the horizontal coordinate and b is the vertical coordinate. This type of plane is called two-dimensional and it contains two perpendicular axes, the horizontal axis, and the vertical axis.
Euclidean Geometry
Geometry is the branch of mathematics that deals with flat surfaces like lines, angles, points, two-dimensional figures, etc. In Euclidean geometry, one studies the geometrical shapes that rely on different theorems and axioms. This (pure mathematics) geometry was introduced by the Greek mathematician Euclid, and that is why it is called Euclidean geometry. Euclid explained this in his book named 'elements'. Euclid's method in Euclidean geometry involves handling a small group of innately captivate axioms and incorporating many of these other propositions. The elements written by Euclid are the fundamentals for the study of geometry from a modern mathematical perspective. Elements comprise Euclidean theories, postulates, axioms, construction, and mathematical proofs of propositions.
Lines and Angles
In a two-dimensional plane, a line is simply a figure that joins two points. Usually, lines are used for presenting objects that are straight in shape and have minimal depth or width.
![**Educational Content on Descriptive Statistics**
**Title: Understanding Descriptive Statistics through a Sample Data Set**
**Introduction:**
In this lesson, we will explore the concepts of range, mean, variance, and standard deviation using a real-life example. This example involves analyzing the ages of a random sample of shoppers at a gaming store.
**Sample Data Set:**
The ages (in years) of the shoppers are as follows:
\[ 12, 18, 23, 14, 14, 16, 20, 16, 14, 16 \]
**Step-by-Step Calculation:**
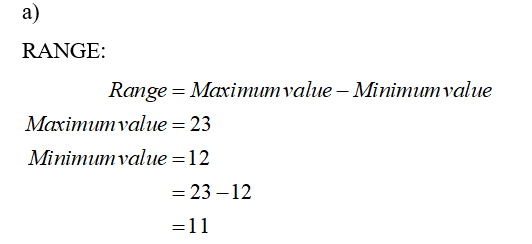
1. **Range:**
The range is the difference between the maximum and minimum values in the data set.
\[ \text{Range} = \text{Maximum value} - \text{Minimum value} \]
From our data:
\[ \text{Maximum value} = 23 \]
\[ \text{Minimum value} = 12 \]
\[ \text{Range} = 23 - 12 = 11 \]
\[ \boxed{\text{Range is 11.}} \]
2. **Mean:**
The mean (average) is calculated by summing all the values and then dividing by the number of values.
\[ \text{Mean} = \frac{\sum \text{Ages}}{\text{Number of Ages}} \]
Sum of Ages:
\[ 12 + 18 + 23 + 14 + 14 + 16 + 20 + 16 + 14 + 16 = 163 \]
Number of Ages:
\[ 10 \]
\[ \text{Mean} = \frac{163}{10} = 16.3 \]
\[ \boxed{\text{Mean is 16.3 (rounded to the nearest tenth).}} \]
3. **Variance and Standard Deviation:**
Due to space constraints, a brief explanation. Variance measures how much the ages vary from the mean. Standard deviation is the square root of variance, indicating the dispersion of the ages around the mean.
These calculations, while not shown step-by-step here, involve subtracting the mean from each age, squaring the result, then averaging those squared differences (for variance) and taking the square root (for standard deviation).
To simplify, you can](/v2/_next/image?url=https%3A%2F%2Fcontent.bartleby.com%2Fqna-images%2Fquestion%2Fee4a3761-e691-4e63-aa29-c4d18ab1c612%2F1fa08f31-d10a-432c-9171-ee553f53b5cc%2Fii9xldqg_reoriented.jpeg&w=3840&q=75)
Given that,
12, 18, 23, 14, 14, 16, 20, 16, 14, 16
b)
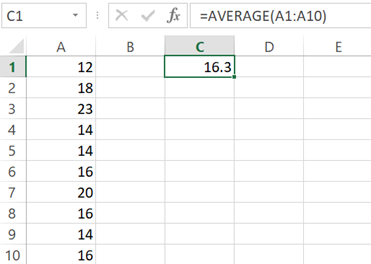
MEAN:
EXCEL,
- Enter the data
- Enter a formula “=AVERAGE(A1:A10)”
- Ok
The output is,

Trending now
This is a popular solution!

Step by step
Solved in 5 steps with 4 images


