Calculus: Early Transcendentals
8th Edition
ISBN:9781285741550
Author:James Stewart
Publisher:James Stewart
Chapter1: Functions And Models
Section: Chapter Questions
Problem 1RCC: (a) What is a function? What are its domain and range? (b) What is the graph of a function? (c) How...
Related questions
Question
#11 can you show me how to do this?

Transcribed Image Text:**Graph Explanation:**
Two graphs are shown, each with a curve on the coordinate plane. They illustrate the concept of the slope of a secant line on a function \( f(x) \).
1. **Graph Details:**
- Both graphs feature a blue curve that corresponds to a function \( f(x) \).
- The \( x \)-axis ranges from 0 to 8, and the \( y \)-axis ranges from -1 to 3.
2. **Key Points:**
- At \( x = 4 \), the point on the curve is labeled \( f(4) \).
- At \( x = 4 + h \), another point on the curve is labeled \( f(4 + h) \).
- The vertical lines from these points on the function down to the \( x \)-axis create a right triangle.
3. **Slope Calculation:**
- The change in \( y \) (vertical side of triangle) is represented as \( f(4 + h) - f(4) \).
- The change in \( x \) (horizontal side) is shown as \( h \).
- The slope of the secant line connecting these two points is given as \( \frac{f(4 + h) - f(4)}{h} \).
**Question:**
What line has slope \(\frac{f(4 + h) - f(4)}{h}\)?
- The options provided are:
- ○ the line from \((f(4), 4)\) to \((f(4) + h, 4 + h)\)
- ○ the line from \((f(4), 4)\) to \((f(4 + h), 4 + h)\)
- ○ the line from \((4, f(4))\) to \((4 + h, f(4) + h)\)
- ○ the line from \((4, f(4))\) to \((4 + h, f(4 + h))\)
**Additional Materials:**
- eBook
The correct choice for the slope representation is the line from \((4, f(4))\) to \((4 + h, f(4 + h))\), which directly corresponds to the definition of a secant line slope using the h-notation.

Transcribed Image Text:The image contains the graphs of a function \( f(x) \) displayed across three separate plots, designed to illustrate the concept of increments and differences at a given point on the curve.
### Top Graph:
- **Graph Description**: This plot depicts the function \( y = f(x) \) as a blue curve on a standard Cartesian plane. The x-axis ranges from \(-1\) to \(6\), and the y-axis ranges from \(-1\) to \(3\).
- **Purpose**: It serves to provide a general view of the function \( y = f(x) \) over the specified domain and range.
### Bottom Left Graph:
- **Graph Description**: Focuses on the behavior of the function around \( x = 4 \). The graph highlights the point \( f(4) \) and a nearby point \( f(4+h) \), with \( h > 0 \).
- **Markings**:
- \( f(4) \): The vertical distance from the x-axis to the curve at \( x = 4 \).
- \( f(4+h) \): The vertical distance from the x-axis to the curve at the point \( x = 4 + h \).
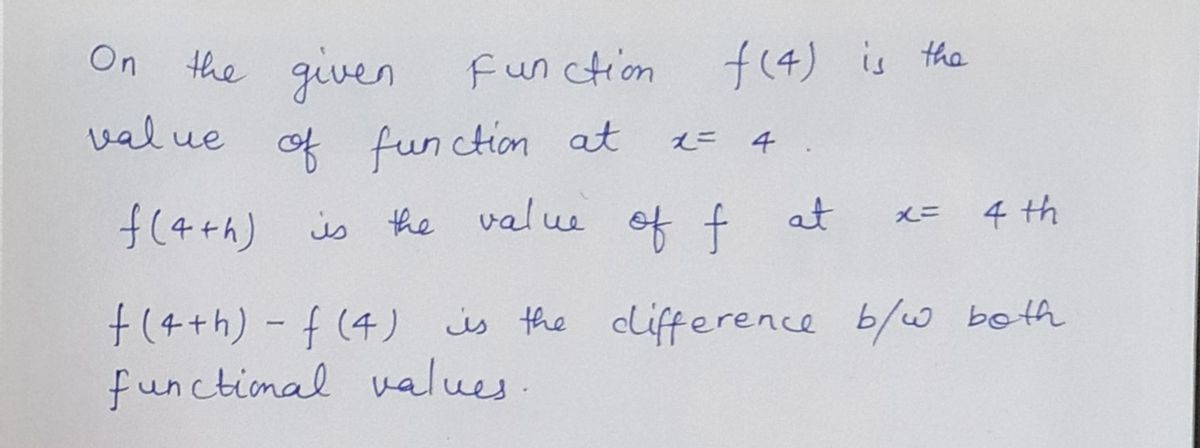
- \( h \): The horizontal segment on the x-axis between \( x = 4 \) and \( x = 4 + h \).
- \( f(4+h) - f(4) \): The vertical segment between the two points on the y-axis, representing the change in \( y \).
### Bottom Right Graph:
- **Graph Description**: Similar to the left graph but with a more detailed depiction of the change in \( y \) values and increment \( h \).
- **Markings**:
- Same elements as in the left graph, labeled clearly for a focused view on the differences and increments calculated between \( x = 4 \) and \( x = 4+h \).
These diagrams are instrumental in understanding the concept of the derivative and how changes in the input \( x \) affect the output \( y \) in small increments, reinforcing the foundation for calculus topics such as limits and slopes of tangent lines.
Expert Solution
Step 1

Step by step
Solved in 2 steps with 2 images

Recommended textbooks for you

Calculus: Early Transcendentals
Calculus
ISBN:
9781285741550
Author:
James Stewart
Publisher:
Cengage Learning

Thomas' Calculus (14th Edition)
Calculus
ISBN:
9780134438986
Author:
Joel R. Hass, Christopher E. Heil, Maurice D. Weir
Publisher:
PEARSON

Calculus: Early Transcendentals (3rd Edition)
Calculus
ISBN:
9780134763644
Author:
William L. Briggs, Lyle Cochran, Bernard Gillett, Eric Schulz
Publisher:
PEARSON

Calculus: Early Transcendentals
Calculus
ISBN:
9781285741550
Author:
James Stewart
Publisher:
Cengage Learning

Thomas' Calculus (14th Edition)
Calculus
ISBN:
9780134438986
Author:
Joel R. Hass, Christopher E. Heil, Maurice D. Weir
Publisher:
PEARSON

Calculus: Early Transcendentals (3rd Edition)
Calculus
ISBN:
9780134763644
Author:
William L. Briggs, Lyle Cochran, Bernard Gillett, Eric Schulz
Publisher:
PEARSON

Calculus: Early Transcendentals
Calculus
ISBN:
9781319050740
Author:
Jon Rogawski, Colin Adams, Robert Franzosa
Publisher:
W. H. Freeman


Calculus: Early Transcendental Functions
Calculus
ISBN:
9781337552516
Author:
Ron Larson, Bruce H. Edwards
Publisher:
Cengage Learning