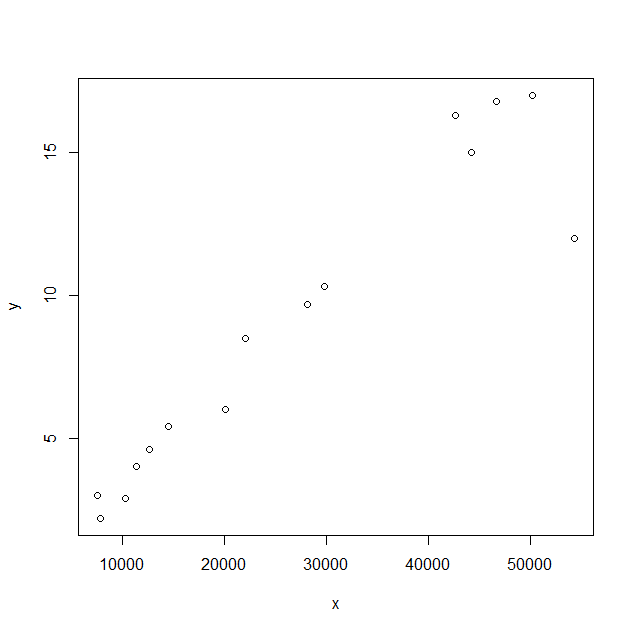
11 387 12 645 14528 20 122 22 122 28 166 29861 54304 44 189 42 651 46678 50 169 7904 10 326 7616 2.9 3.0 4.0 4.6 5.4 6.0 2.2 8.5 9.7 10.3 12.0 15.0 16.3 16.8 17.0 Plot a scatter diagram for this data. a b Describe the correlation. c Find the mean GDP. 4. Find the mean number of books read per person in a year. . Plot and label the mean point on the scatter diagram. f Draw a line of best fit by eye through the mean point.
11 387 12 645 14528 20 122 22 122 28 166 29861 54304 44 189 42 651 46678 50 169 7904 10 326 7616 2.9 3.0 4.0 4.6 5.4 6.0 2.2 8.5 9.7 10.3 12.0 15.0 16.3 16.8 17.0 Plot a scatter diagram for this data. a b Describe the correlation. c Find the mean GDP. 4. Find the mean number of books read per person in a year. . Plot and label the mean point on the scatter diagram. f Draw a line of best fit by eye through the mean point.

MATLAB: An Introduction with Applications
6th Edition
ISBN:9781119256830
Author:Amos Gilat
Publisher:Amos Gilat
Chapter1: Starting With Matlab
Section: Chapter Questions
Problem 1P

Related questions
Question

Transcribed Image Text:r7904 10 326 7616
3.0
11 387 12 645
14 528 20 122
22 122 28 166 29 861 54304 44189 42 651 46678 50 169
2.9
4.0
4.6
5.4
6.0
2.2
y
8.5
9.7
10.3
12.0
15.0
a Plot a scatter diagram for this data.
16.3
16.8
17.0
b Describe the correlation.
c Find the mean GDP.
4. Find the mean number of books read per person in a year.
e Plot and label the mean point on the scatter diagram.
f Draw a line of best fit by eye through the mean point.
nvestigation 6
y
10
L:y=0,81x + 2.36
%D
this investigation you will see that a line of best fit drawn by
ye through the mean point can be improved.
9.
8
What do you think "improve" means in this context?
00.65x+3
6.
ight data points and also
Expert Solution
Step 1
Scatterplot

Step by step
Solved in 2 steps with 2 images

Recommended textbooks for you
MATLAB: An Introduction with Applications
Statistics
ISBN:
9781119256830
Author:
Amos Gilat
Publisher:
John Wiley & Sons Inc

Probability and Statistics for Engineering and th…
Statistics
ISBN:
9781305251809
Author:
Jay L. Devore
Publisher:
Cengage Learning

Statistics for The Behavioral Sciences (MindTap C…
Statistics
ISBN:
9781305504912
Author:
Frederick J Gravetter, Larry B. Wallnau
Publisher:
Cengage Learning
MATLAB: An Introduction with Applications
Statistics
ISBN:
9781119256830
Author:
Amos Gilat
Publisher:
John Wiley & Sons Inc
Probability and Statistics for Engineering and th…
Statistics
ISBN:
9781305251809
Author:
Jay L. Devore
Publisher:
Cengage Learning
Statistics for The Behavioral Sciences (MindTap C…
Statistics
ISBN:
9781305504912
Author:
Frederick J Gravetter, Larry B. Wallnau
Publisher:
Cengage Learning

Elementary Statistics: Picturing the World (7th E…
Statistics
ISBN:
9780134683416
Author:
Ron Larson, Betsy Farber
Publisher:
PEARSON

The Basic Practice of Statistics
Statistics
ISBN:
9781319042578
Author:
David S. Moore, William I. Notz, Michael A. Fligner
Publisher:
W. H. Freeman

Introduction to the Practice of Statistics
Statistics
ISBN:
9781319013387
Author:
David S. Moore, George P. McCabe, Bruce A. Craig
Publisher:
W. H. Freeman