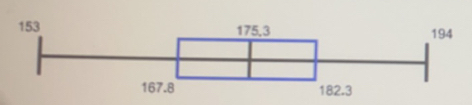
10. The boxplot shown below results from the heights (cm) of males listed in a data set. What do the numbers in that boxplot tell us? 153 The minimum height is 167.8 175,3 182.3 cm, the first quartile Q, is cm, the third quartile Q, is (Type integers or decimals. Do not round.) 194 cm, the second quartile Q₂ (or the median) is cm, and the maximum height is cm.
10. The boxplot shown below results from the heights (cm) of males listed in a data set. What do the numbers in that boxplot tell us? 153 The minimum height is 167.8 175,3 182.3 cm, the first quartile Q, is cm, the third quartile Q, is (Type integers or decimals. Do not round.) 194 cm, the second quartile Q₂ (or the median) is cm, and the maximum height is cm.

MATLAB: An Introduction with Applications
6th Edition
ISBN:9781119256830
Author:Amos Gilat
Publisher:Amos Gilat
Chapter1: Starting With Matlab
Section: Chapter Questions
Problem 1P

Related questions
Question
100%

Transcribed Image Text:chrome - Search
Real Estate Pra... G Gmail
xa google docs - Search
https://outlook.office.com/mail/inbox/id/AAQKAGFIYTAOYzEwLTEzN2UtNGEOZS1hODU2LWNkZjM5ZjA1MmM1YQAQABGrXbucfk5
YouTube Maps Ge G Author Study Paper
Alvernia Outlook
ML Chapter 3 HW.pdf
153
Download Print
The minimum height is
167.8
175,3
Save to OneDrive
10. The boxplot shown below results from the heights (cm) of males listed in a data set. What do the numbers in that boxplot tell us?
cm, the third quartile Q, is
(Type integers or decimals. Do not round.)
182.3
cm, the first quartile Q, is
outlook email - Search
194
LOGINS P Assessment 3-1A
Mail - Olivia Barone - Outlo
b A Problem Solving...
cm.
cm, the second quartile Q₂ (or the median) is
cm, and the maximum height is
11. A data set lists weights (lb) of plastic discarded by households. The highest weight is 5.28 lb, the mean of all of the weights is x = 2.094
Ib, and the standard deviation of the weights is s= 1.964 lb.
Expert Solution
Step 1

Trending now
This is a popular solution!

Step by step
Solved in 2 steps with 1 images

Recommended textbooks for you
MATLAB: An Introduction with Applications
Statistics
ISBN:
9781119256830
Author:
Amos Gilat
Publisher:
John Wiley & Sons Inc

Probability and Statistics for Engineering and th…
Statistics
ISBN:
9781305251809
Author:
Jay L. Devore
Publisher:
Cengage Learning

Statistics for The Behavioral Sciences (MindTap C…
Statistics
ISBN:
9781305504912
Author:
Frederick J Gravetter, Larry B. Wallnau
Publisher:
Cengage Learning
MATLAB: An Introduction with Applications
Statistics
ISBN:
9781119256830
Author:
Amos Gilat
Publisher:
John Wiley & Sons Inc
Probability and Statistics for Engineering and th…
Statistics
ISBN:
9781305251809
Author:
Jay L. Devore
Publisher:
Cengage Learning
Statistics for The Behavioral Sciences (MindTap C…
Statistics
ISBN:
9781305504912
Author:
Frederick J Gravetter, Larry B. Wallnau
Publisher:
Cengage Learning

Elementary Statistics: Picturing the World (7th E…
Statistics
ISBN:
9780134683416
Author:
Ron Larson, Betsy Farber
Publisher:
PEARSON

The Basic Practice of Statistics
Statistics
ISBN:
9781319042578
Author:
David S. Moore, William I. Notz, Michael A. Fligner
Publisher:
W. H. Freeman

Introduction to the Practice of Statistics
Statistics
ISBN:
9781319013387
Author:
David S. Moore, George P. McCabe, Bruce A. Craig
Publisher:
W. H. Freeman