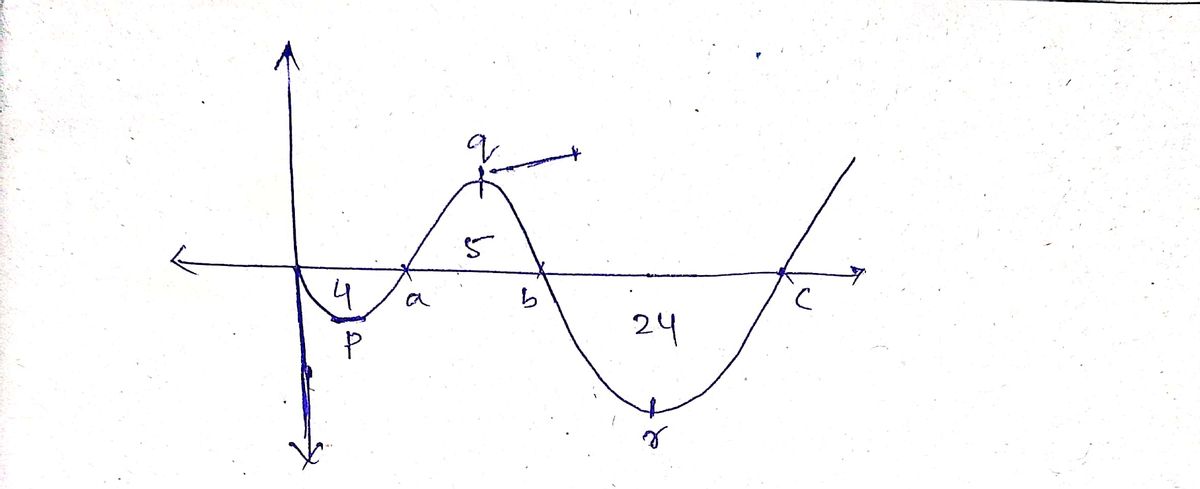
10) A particle is moving along the x-axis. The graph at right shows its velocity over time. The numbers shown are the areas of the regions. a) Approximately when, in the interval (0,c), does the particle reach its greatest speed? 4. 24 b) Approximately when does the particle have an acceleration of zero? c) What is the particle's displacement at time t = c? {This counts as three separate problems – they each may be correct or have an error.} Solution? a) The greatest speed is at the largest value; that is, somewhere approximately in the middle of the interval [a, b]. b) The particle has an acceleration of zero at t = 0, a, b, & c as that is when the graph crosses the t-axis. c) The displacement at t = c is just 4 + 5+ 24 = 33 units.
10) A particle is moving along the x-axis. The graph at right shows its velocity over time. The numbers shown are the areas of the regions. a) Approximately when, in the interval (0,c), does the particle reach its greatest speed? 4. 24 b) Approximately when does the particle have an acceleration of zero? c) What is the particle's displacement at time t = c? {This counts as three separate problems – they each may be correct or have an error.} Solution? a) The greatest speed is at the largest value; that is, somewhere approximately in the middle of the interval [a, b]. b) The particle has an acceleration of zero at t = 0, a, b, & c as that is when the graph crosses the t-axis. c) The displacement at t = c is just 4 + 5+ 24 = 33 units.
Algebra and Trigonometry (6th Edition)
6th Edition
ISBN:9780134463216
Author:Robert F. Blitzer
Publisher:Robert F. Blitzer
ChapterP: Prerequisites: Fundamental Concepts Of Algebra
Section: Chapter Questions
Problem 1MCCP: In Exercises 1-25, simplify the given expression or perform the indicated operation (and simplify,...
Related questions
Concept explainers
Contingency Table
A contingency table can be defined as the visual representation of the relationship between two or more categorical variables that can be evaluated and registered. It is a categorical version of the scatterplot, which is used to investigate the linear relationship between two variables. A contingency table is indeed a type of frequency distribution table that displays two variables at the same time.
Binomial Distribution
Binomial is an algebraic expression of the sum or the difference of two terms. Before knowing about binomial distribution, we must know about the binomial theorem.
Topic Video
Question
Identify if there are any errors in the solutions, and state what they are. Thanks
![10) A particle is moving along the x-axis. The graph at right shows its velocity over
time. The numbers shown are the areas of the regions.
a) Approximately when, in the interval [0, c], does the particle reach its greatest
speed?
4 fa
24
b) Approximately when does the particle have an acceleration of zero?
c) What is the particle's displacement at time t = c?
{This counts as three separate problems - they each may be correct or have an error.}
Solution?
a) The greatest speed is at the largest value; that is, somewhere approximately in the middle of the interval [a, b].
b) The particle has an acceleration of zero at t = 0, a, b, & c as that is when the graph crosses the t-axis.
c) The displacement at t = c is just 4 + 5+ 24 = 33 units.](/v2/_next/image?url=https%3A%2F%2Fcontent.bartleby.com%2Fqna-images%2Fquestion%2F8ce2e611-8c07-4409-a463-d0a61141ee83%2F157790a4-c879-4648-9098-acba57ae1943%2Ft941smn_processed.png&w=3840&q=75)
Transcribed Image Text:10) A particle is moving along the x-axis. The graph at right shows its velocity over
time. The numbers shown are the areas of the regions.
a) Approximately when, in the interval [0, c], does the particle reach its greatest
speed?
4 fa
24
b) Approximately when does the particle have an acceleration of zero?
c) What is the particle's displacement at time t = c?
{This counts as three separate problems - they each may be correct or have an error.}
Solution?
a) The greatest speed is at the largest value; that is, somewhere approximately in the middle of the interval [a, b].
b) The particle has an acceleration of zero at t = 0, a, b, & c as that is when the graph crosses the t-axis.
c) The displacement at t = c is just 4 + 5+ 24 = 33 units.
Expert Solution
Step 1

Step by step
Solved in 2 steps with 2 images

Knowledge Booster
Learn more about
Need a deep-dive on the concept behind this application? Look no further. Learn more about this topic, algebra and related others by exploring similar questions and additional content below.Recommended textbooks for you

Algebra and Trigonometry (6th Edition)
Algebra
ISBN:
9780134463216
Author:
Robert F. Blitzer
Publisher:
PEARSON

Contemporary Abstract Algebra
Algebra
ISBN:
9781305657960
Author:
Joseph Gallian
Publisher:
Cengage Learning

Linear Algebra: A Modern Introduction
Algebra
ISBN:
9781285463247
Author:
David Poole
Publisher:
Cengage Learning

Algebra and Trigonometry (6th Edition)
Algebra
ISBN:
9780134463216
Author:
Robert F. Blitzer
Publisher:
PEARSON

Contemporary Abstract Algebra
Algebra
ISBN:
9781305657960
Author:
Joseph Gallian
Publisher:
Cengage Learning

Linear Algebra: A Modern Introduction
Algebra
ISBN:
9781285463247
Author:
David Poole
Publisher:
Cengage Learning

Algebra And Trigonometry (11th Edition)
Algebra
ISBN:
9780135163078
Author:
Michael Sullivan
Publisher:
PEARSON

Introduction to Linear Algebra, Fifth Edition
Algebra
ISBN:
9780980232776
Author:
Gilbert Strang
Publisher:
Wellesley-Cambridge Press

College Algebra (Collegiate Math)
Algebra
ISBN:
9780077836344
Author:
Julie Miller, Donna Gerken
Publisher:
McGraw-Hill Education