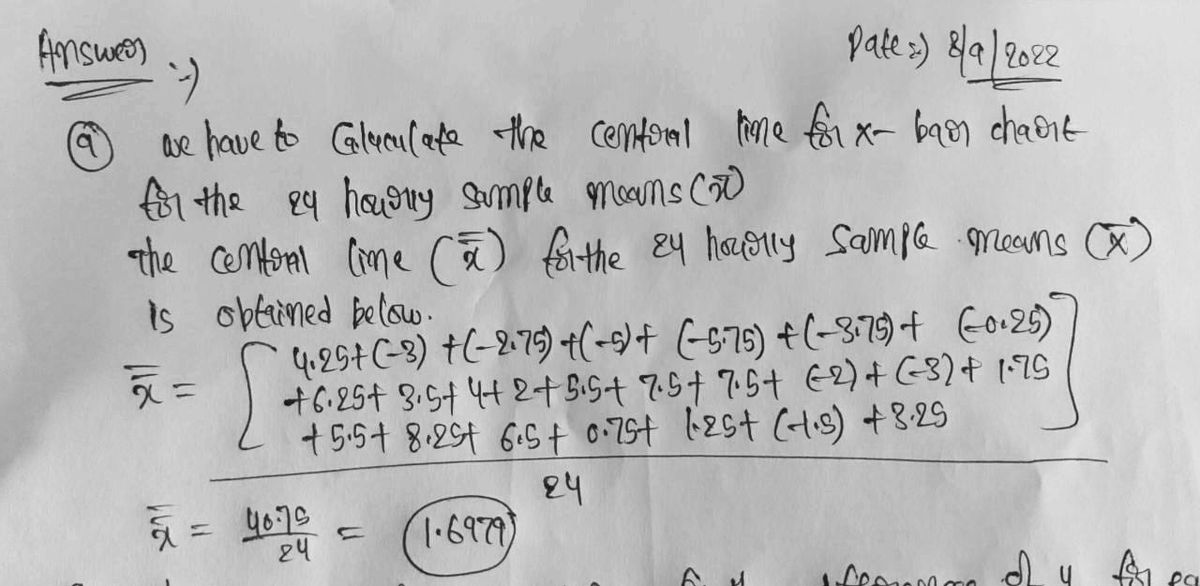
1.8 A Canadian manufacturer identified a critical diameter on a crank bore that needed to be maintained within a close tolerance for the product to be successful. Sam- ples of size 4 were taken every hour. The values of the differences (measurement — specification), in ten- thousandths of an inch, are given in Table 1.4. (a) Calculate the central line for an X-bar chart for the 24 hourly sample means. The centerline is x = — . . . (4.25 -3.00 -1.50 +3.25)/24. = (b) Is the average of all the numbers in the table, 4 for each hour, the same as the average of the 24 hourly averages? Should it be? (c) A computer calculation gives the control limits LCL = -4.48 UCL 7.88 = Construct the X-bar chart. Identify hours where the process was out of control.
1.8 A Canadian manufacturer identified a critical diameter on a crank bore that needed to be maintained within a close tolerance for the product to be successful. Sam- ples of size 4 were taken every hour. The values of the differences (measurement — specification), in ten- thousandths of an inch, are given in Table 1.4. (a) Calculate the central line for an X-bar chart for the 24 hourly sample means. The centerline is x = — . . . (4.25 -3.00 -1.50 +3.25)/24. = (b) Is the average of all the numbers in the table, 4 for each hour, the same as the average of the 24 hourly averages? Should it be? (c) A computer calculation gives the control limits LCL = -4.48 UCL 7.88 = Construct the X-bar chart. Identify hours where the process was out of control.

MATLAB: An Introduction with Applications
6th Edition
ISBN:9781119256830
Author:Amos Gilat
Publisher:Amos Gilat
Chapter1: Starting With Matlab
Section: Chapter Questions
Problem 1P

Related questions
Question

Transcribed Image Text:1.8 A Canadian manufacturer identified a critical diameter
on a crank bore that needed to be maintained within a
close tolerance for the product to be successful. Sam-
ples of size 4 were taken every hour. The values of
the differences (measurement - specification), in ten-
thousandths of an inch, are given in Table 1.4.
(a) Calculate the central line for an X-bar chart for
the 24 hourly sample means. The centerline is
x = — . . .
(4.25 -3.00 -1.50 +3.25)/24.
=
(b) Is the average of all the numbers in the table, 4 for
each hour, the same as the average of the 24 hourly
averages? Should it be?
(c) A computer calculation gives the control limits
LCL = -4.48
UCL 7.88
=
Construct the X-bar chart. Identify hours where
the process was out of control.

Transcribed Image Text:Table 1.4 The differences (measurement
thousandths of an inch
2
3
Hour
I
10
Hour 13 14
5
9
=
6
6
8
10
-1
4
15
-5
4
-5
-2
5
-7
-2
-6
-8
5 2 5
3
1
-3 -3
-3
7
6
1
3
6
-4
0
9
1
3
1
10
-2
-3 -7
7 11
7 2 4
4
4.25 -3.00 -2.75 -5.00 -5.75 -3.75 -0.25 6.25 3.50 4.00 2.00 5.50
6
-14
7
-6 -1
-6
-1
-5 -2
-6
-1
2
-6
specification), in ten-
13
8
9 10 ||
16 17 18 19 20 21 22
-8
2 7
8
5
8 -5
-5
8
7
4 1
7
9
1
-4 5
6
7
0
1
7
0 1
3
6 10 -6 2
7.50 7.50 -2.00 -3.00 1.75 5.50 8.25 6.50 0.75 1.25 -1.50 3.25
12
8 -1
23 24
-2 -1
-4 5
-7
9
7
0
Expert Solution
Step 1

Step by step
Solved in 3 steps with 3 images

Recommended textbooks for you
MATLAB: An Introduction with Applications
Statistics
ISBN:
9781119256830
Author:
Amos Gilat
Publisher:
John Wiley & Sons Inc

Probability and Statistics for Engineering and th…
Statistics
ISBN:
9781305251809
Author:
Jay L. Devore
Publisher:
Cengage Learning

Statistics for The Behavioral Sciences (MindTap C…
Statistics
ISBN:
9781305504912
Author:
Frederick J Gravetter, Larry B. Wallnau
Publisher:
Cengage Learning
MATLAB: An Introduction with Applications
Statistics
ISBN:
9781119256830
Author:
Amos Gilat
Publisher:
John Wiley & Sons Inc
Probability and Statistics for Engineering and th…
Statistics
ISBN:
9781305251809
Author:
Jay L. Devore
Publisher:
Cengage Learning
Statistics for The Behavioral Sciences (MindTap C…
Statistics
ISBN:
9781305504912
Author:
Frederick J Gravetter, Larry B. Wallnau
Publisher:
Cengage Learning

Elementary Statistics: Picturing the World (7th E…
Statistics
ISBN:
9780134683416
Author:
Ron Larson, Betsy Farber
Publisher:
PEARSON

The Basic Practice of Statistics
Statistics
ISBN:
9781319042578
Author:
David S. Moore, William I. Notz, Michael A. Fligner
Publisher:
W. H. Freeman

Introduction to the Practice of Statistics
Statistics
ISBN:
9781319013387
Author:
David S. Moore, George P. McCabe, Bruce A. Craig
Publisher:
W. H. Freeman