Calculus: Early Transcendentals
8th Edition
ISBN:9781285741550
Author:James Stewart
Publisher:James Stewart
Chapter1: Functions And Models
Section: Chapter Questions
Problem 1RCC: (a) What is a function? What are its domain and range? (b) What is the graph of a function? (c) How...
Related questions
Concept explainers
Contingency Table
A contingency table can be defined as the visual representation of the relationship between two or more categorical variables that can be evaluated and registered. It is a categorical version of the scatterplot, which is used to investigate the linear relationship between two variables. A contingency table is indeed a type of frequency distribution table that displays two variables at the same time.
Binomial Distribution
Binomial is an algebraic expression of the sum or the difference of two terms. Before knowing about binomial distribution, we must know about the binomial theorem.
Topic Video
Question
![### Problem Statement
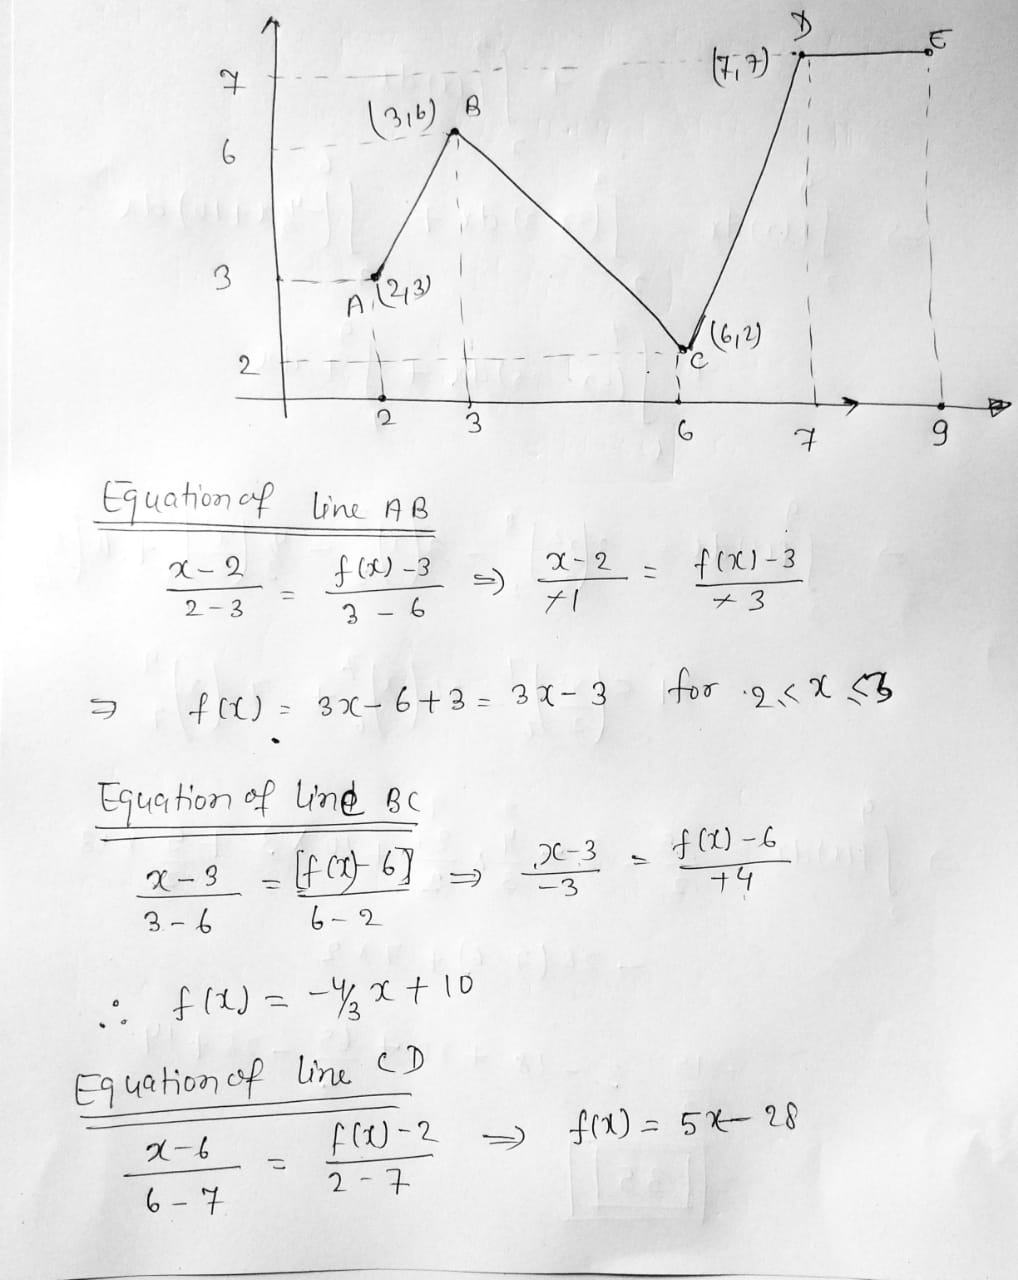
If the graph of \( f \) is shown above, what is the value of the following integral?
\[
\int_{2}^{9} f(x) \, dx
\]
### Explanation
- **Integral Notation:** The expression \(\int_{2}^{9} f(x) \, dx\) represents the definite integral of the function \( f(x) \) from \( x = 2 \) to \( x = 9 \). This integral calculates the net area between the graph of the function and the x-axis over the interval [2, 9].
### Considerations
- The specific graph of \( f(x) \) is not visible here. To solve, you would evaluate the area under the curve or use any available analytical methods or properties of \( f(x) \) as described in the graph.
- **Visual Elements (Hypothetical):**
- **Graph:** If you had access to the graph, observe the behavior of \( f(x) \) between \( x = 2 \) and \( x = 9 \) to determine areas above or below the x-axis.
- **Axis Labels:** Ensure any x and y-axis labels or scales are checked for units or relevant intersections.
**Instructions for Further Study:**
- Explore properties of definite integrals, such as additivity and the relation to antiderivatives.
- Practice finding areas under a curve, potentially using Riemann sums or graphical analysis if a graph is available.](/v2/_next/image?url=https%3A%2F%2Fcontent.bartleby.com%2Fqna-images%2Fquestion%2F0a7d5833-bdac-47ce-81d6-567cc926b1bc%2F7527a362-f70e-446b-8f12-7f42442509fe%2F1hgvygm_processed.png&w=3840&q=75)
Transcribed Image Text:### Problem Statement
If the graph of \( f \) is shown above, what is the value of the following integral?
\[
\int_{2}^{9} f(x) \, dx
\]
### Explanation
- **Integral Notation:** The expression \(\int_{2}^{9} f(x) \, dx\) represents the definite integral of the function \( f(x) \) from \( x = 2 \) to \( x = 9 \). This integral calculates the net area between the graph of the function and the x-axis over the interval [2, 9].
### Considerations
- The specific graph of \( f(x) \) is not visible here. To solve, you would evaluate the area under the curve or use any available analytical methods or properties of \( f(x) \) as described in the graph.
- **Visual Elements (Hypothetical):**
- **Graph:** If you had access to the graph, observe the behavior of \( f(x) \) between \( x = 2 \) and \( x = 9 \) to determine areas above or below the x-axis.
- **Axis Labels:** Ensure any x and y-axis labels or scales are checked for units or relevant intersections.
**Instructions for Further Study:**
- Explore properties of definite integrals, such as additivity and the relation to antiderivatives.
- Practice finding areas under a curve, potentially using Riemann sums or graphical analysis if a graph is available.

Transcribed Image Text:The image displays a line graph on a coordinate plane with the x-axis labeled from -1 to 10 and the y-axis labeled from -1 to 10.
**Description of the Graph:**
- **Axes:** The graph is a standard Cartesian coordinate system with grid lines and points marked at regular intervals.
- **Data Points and Lines:**
- The graph consists of a zigzag blue line connecting four data points.
- Starting from the bottom left, the line ascends to a peak, then descends to a trough, and finally rises again before plateauing.
- **Data Points:**
- First point is near the origin.
- Second point is a peak on the positive y-axis.
- Third point is at the bottom of the graph.
- Fourth point moves up again, creating another peak before leveling off horizontally.
- **Trend:**
- Initial rise in values followed by a decrease, then another increase and leveling off, indicating fluctuating data over time or another variable.
This pattern may be characteristic of scenarios like stock market fluctuations, temperature changes, or other cyclical phenomena, depending on the context it represents.
Expert Solution
Step 1

Step by step
Solved in 2 steps with 2 images

Knowledge Booster
Learn more about
Need a deep-dive on the concept behind this application? Look no further. Learn more about this topic, calculus and related others by exploring similar questions and additional content below.Recommended textbooks for you

Calculus: Early Transcendentals
Calculus
ISBN:
9781285741550
Author:
James Stewart
Publisher:
Cengage Learning

Thomas' Calculus (14th Edition)
Calculus
ISBN:
9780134438986
Author:
Joel R. Hass, Christopher E. Heil, Maurice D. Weir
Publisher:
PEARSON

Calculus: Early Transcendentals (3rd Edition)
Calculus
ISBN:
9780134763644
Author:
William L. Briggs, Lyle Cochran, Bernard Gillett, Eric Schulz
Publisher:
PEARSON

Calculus: Early Transcendentals
Calculus
ISBN:
9781285741550
Author:
James Stewart
Publisher:
Cengage Learning

Thomas' Calculus (14th Edition)
Calculus
ISBN:
9780134438986
Author:
Joel R. Hass, Christopher E. Heil, Maurice D. Weir
Publisher:
PEARSON

Calculus: Early Transcendentals (3rd Edition)
Calculus
ISBN:
9780134763644
Author:
William L. Briggs, Lyle Cochran, Bernard Gillett, Eric Schulz
Publisher:
PEARSON

Calculus: Early Transcendentals
Calculus
ISBN:
9781319050740
Author:
Jon Rogawski, Colin Adams, Robert Franzosa
Publisher:
W. H. Freeman


Calculus: Early Transcendental Functions
Calculus
ISBN:
9781337552516
Author:
Ron Larson, Bruce H. Edwards
Publisher:
Cengage Learning