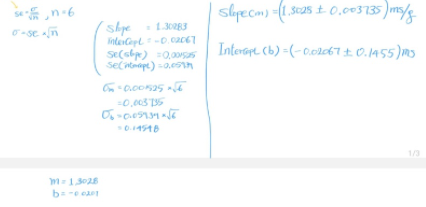
1. You are building a robotic instrument that automatically dispenses some volume that you specify of stock solution into a reaction vessel. This instrument works by opening and closing a valve for a specific amount of time, and you would like to calibrate it by determining how much time the valve needs to be open to dispense a give volume. You calibrate this instrument by choosing a series of times and measuring the mass of water dispensed into a weigh boat on an analytical balance. Your results are below: Mass (g) 13.07 Time (ms) 10 20 25.98 30 38.99 40 52.15 65.14 50 60 78.14 a. Plot this data in excel. Does it look linear? b. Use LINEST to fit this data to a line. Report the slope and y intercept with 1o uncertainty and correct units. Stdrd emn of the Sple slepecm) (1.52 Se - g n=6 3028 ± 0.003735 skpe înterCept = -0.02067 Se(sbpe) =0.001525 secintiept) =0.0511 = 1.30283 0 = se xn Interapt (b) =(-0.02A7 ± 0.1455)Ms Om = 0.001525*6 =0.003735 Oo =0.05139 xS6 = 0.14548 1/3 M = 1,3028 b= -0 020I c. Now that you know m and b, calculate the volume of solution dispensed when the valve is open for 55.4 ms. Note you will need to look up the density of water! d. What is the uncertainty of this volume? You will need to use the uncertainties of m and b and propagate the error.
1. You are building a robotic instrument that automatically dispenses some volume that you specify of stock solution into a reaction vessel. This instrument works by opening and closing a valve for a specific amount of time, and you would like to calibrate it by determining how much time the valve needs to be open to dispense a give volume. You calibrate this instrument by choosing a series of times and measuring the mass of water dispensed into a weigh boat on an analytical balance. Your results are below: Mass (g) 13.07 Time (ms) 10 20 25.98 30 38.99 40 52.15 65.14 50 60 78.14 a. Plot this data in excel. Does it look linear? b. Use LINEST to fit this data to a line. Report the slope and y intercept with 1o uncertainty and correct units. Stdrd emn of the Sple slepecm) (1.52 Se - g n=6 3028 ± 0.003735 skpe înterCept = -0.02067 Se(sbpe) =0.001525 secintiept) =0.0511 = 1.30283 0 = se xn Interapt (b) =(-0.02A7 ± 0.1455)Ms Om = 0.001525*6 =0.003735 Oo =0.05139 xS6 = 0.14548 1/3 M = 1,3028 b= -0 020I c. Now that you know m and b, calculate the volume of solution dispensed when the valve is open for 55.4 ms. Note you will need to look up the density of water! d. What is the uncertainty of this volume? You will need to use the uncertainties of m and b and propagate the error.

MATLAB: An Introduction with Applications
6th Edition
ISBN:9781119256830
Author:Amos Gilat
Publisher:Amos Gilat
Chapter1: Starting With Matlab
Section: Chapter Questions
Problem 1P

Related questions

Concept explainers
Equations and Inequations
Equations and inequalities describe the relationship between two mathematical expressions.
Linear Functions
A linear function can just be a constant, or it can be the constant multiplied with the variable like x or y. If the variables are of the form, x2, x1/2 or y2 it is not linear. The exponent over the variables should always be 1.
Question
I posted the data I got. How to solve C and D??
Please explain me..

Transcribed Image Text:1. You are building a robotic instrument that automatically dispenses some volume
that you specify of stock solution into a reaction vessel. This instrument works by
opening and closing a valve for a specific amount of time, and you would like to
calibrate it by determining how much time the valve needs to be open to
dispense a give volume. You calibrate this instrument by choosing a series of
times and measuring the mass of water dispensed into a weigh boat on an
analytical balance. Your results are below:
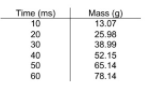
Time (ms)
10
Mass (g)
13.07
20
25.98
30
38.99
40
52.15
50
65.14
60
78.14
a. Plot this data in excel. Does it look linear?
b. Use LINEST to fit this data to a line. Report the slope and y intercept with
1o uncertainty and correct units.
Stndard eh
of the Sple
3028 ± 0.003735
se
= 1.30283
0 =se xn
înterCept = -0.02067
se(slpe) =0,001595
secinticept) =0.0511
Interapt (b) =(-0.02AT± 0.1455)M5
Om = 0.001525 6
=0,003735
Oo=0.05939 xSG
= 0.14548
1/3
M = 1,3028
b= -0 020T
c. Now that you know m and b, calculate the volume of solution dispensed
when the valve is open for 55.4 ms. Note you will need to look up the
density of water!
d. What is the uncertainty of this volume? You will need to use the
uncertainties of m and b and propagate the error.

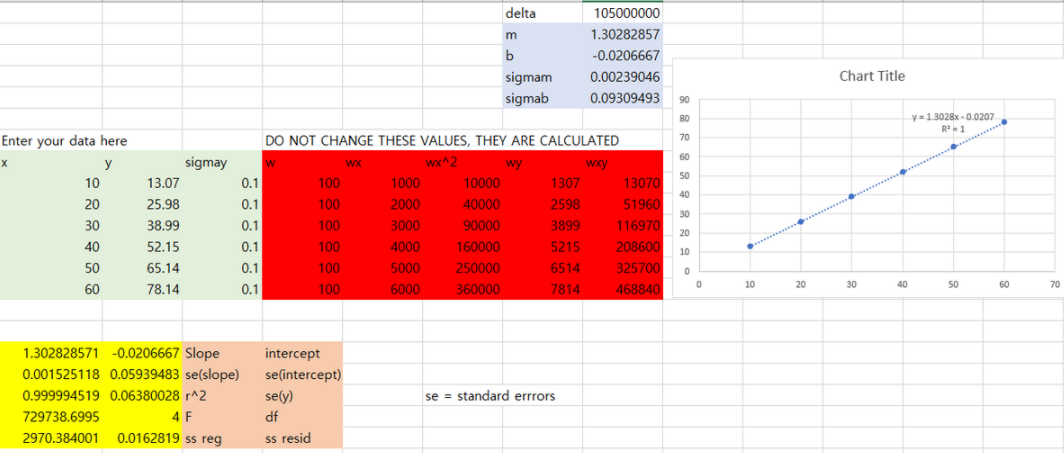
Transcribed Image Text:delta
105000000
1.30282857
b
-0.0206667
sigmam
0.00239046
Chart Title
sigmab
0.09309493
90
y = 1.3028x - 0.0207
R= 1
80
70
Enter your data here
DO NOT CHANGE THESE VALUES, THEY ARE CALCULATED
60
sigmay
0.1
y
wx^2
WX
wy
wxy
**
50
10
13.07
100
1000
10000
1307
13070
40
20
25.98
0.1
100
2000
40000
2598
51960
30
30
38.99
0.1
100
3000
90000
3899
116970
20
40
52.15
0.1
100
4000
160000
5215
208600
10
50
65.14
0.1
100
5000
250000
6514
325700
10
20
30
40
50
60
70
60
78.14
0.1
100
6000
360000
7814
468840
1.302828571 -0.0206667 Slope
intercept
0.001525118 0.05939483 se(slope)
se(intercept)
0.999994519 0.06380028 r^2
sely)
se = standard errrors
729738.6995
4 F
df
2970.384001
0.0162819 ss reg
ss resid
Expert Solution
Step 1
Given information are-
 and
and

Trending now
This is a popular solution!

Step by step
Solved in 3 steps with 3 images

Knowledge Booster


Learn more about
Need a deep-dive on the concept behind this application? Look no further. Learn more about this topic, statistics and related others by exploring similar questions and additional content below.Recommended textbooks for you
MATLAB: An Introduction with Applications
Statistics
ISBN:
9781119256830
Author:
Amos Gilat
Publisher:
John Wiley & Sons Inc

Probability and Statistics for Engineering and th…
Statistics
ISBN:
9781305251809
Author:
Jay L. Devore
Publisher:
Cengage Learning

Statistics for The Behavioral Sciences (MindTap C…
Statistics
ISBN:
9781305504912
Author:
Frederick J Gravetter, Larry B. Wallnau
Publisher:
Cengage Learning
MATLAB: An Introduction with Applications
Statistics
ISBN:
9781119256830
Author:
Amos Gilat
Publisher:
John Wiley & Sons Inc
Probability and Statistics for Engineering and th…
Statistics
ISBN:
9781305251809
Author:
Jay L. Devore
Publisher:
Cengage Learning
Statistics for The Behavioral Sciences (MindTap C…
Statistics
ISBN:
9781305504912
Author:
Frederick J Gravetter, Larry B. Wallnau
Publisher:
Cengage Learning

Elementary Statistics: Picturing the World (7th E…
Statistics
ISBN:
9780134683416
Author:
Ron Larson, Betsy Farber
Publisher:
PEARSON

The Basic Practice of Statistics
Statistics
ISBN:
9781319042578
Author:
David S. Moore, William I. Notz, Michael A. Fligner
Publisher:
W. H. Freeman

Introduction to the Practice of Statistics
Statistics
ISBN:
9781319013387
Author:
David S. Moore, George P. McCabe, Bruce A. Craig
Publisher:
W. H. Freeman