Calculus: Early Transcendentals
8th Edition
ISBN:9781285741550
Author:James Stewart
Publisher:James Stewart
Chapter1: Functions And Models
Section: Chapter Questions
Problem 1RCC: (a) What is a function? What are its domain and range? (b) What is the graph of a function? (c) How...
Related questions
Question
9

Transcribed Image Text:### Graphing a Polynomial
You are a tutor who is helping a student graph a polynomial. They have the following information:
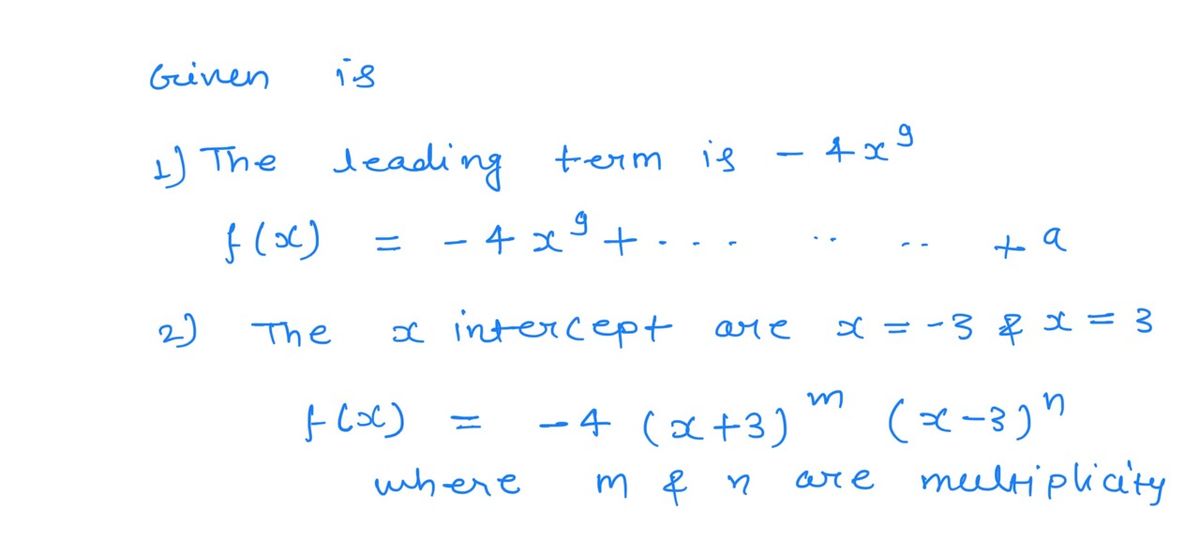
1. **The leading term** is \( -4x^9 \).
2. **The \( x \)-intercepts** are \( x = -3 \) and \( x = 3 \).
3. **The multiplicity of \( x = -3 \)** is 4.
4. **The multiplicity of \( x = 3 \)** is 5.
### Explanation
- **Leading Term**: The leading term of a polynomial affects the end behavior of its graph. Here, the leading term \( -4x^9 \) indicates that the polynomial's degree is 9, and the negative coefficient will cause the ends of the graph to point in opposite directions (downward for odd degrees).
- **X-Intercepts**: These are the points where the graph crosses the x-axis. The given x-intercepts are \( x = -3 \) and \( x = 3 \).
- **Multiplicity**: This is the number of times a particular root is repeated. A root with even multiplicity will touch the x-axis and turn back, while one with odd multiplicity will cross the x-axis.
- \( x = -3 \) has a multiplicity of 4 (even), so the graph will touch and rebound at this intercept.
- \( x = 3 \) has a multiplicity of 5 (odd), so the graph will cross the x-axis at this intercept.

Transcribed Image Text:**Problem:** The student tried to graph the problem and got this graph displayed above.
**Graph Analysis:**
The graph shown is a smooth curve with the following characteristics:
- The x-axis ranges from -4 to 5.
- The y-axis seems to have no specific scale visibly labeled.
- The curve starts around y = 0 at x = -4, increases to a peak near x = -2, then decreases through the origin at x = 0.
- It continues to decrease to a low point slightly beyond x = 2, and then increases again, exiting the top of the graph area near x = 5.
**Mistake Explanation and Correction:**
1. **Identify the Problem:**
- Before assuming this graph is incorrect, ensure that it matches the intended function. Common mistakes might occur if there are calculation errors or incorrect inputs in plotting software.
2. **Check Critical Points:**
- Verify the known critical points (peaks and valleys) for accuracy. Calculate these using first and second derivatives if the function is differentiable.
3. **Correct Axis Labels and Scaling:**
- Ensure that both axes, especially the y-axis, have the correct scale or intervals to reflect true values accurately.
4. **Re-evaluate the Function Formula:**
- Double-check the function formula for transcription errors. Even a small mistake in a sign or coefficient can lead to the wrong graph shape.
5. **Software or Calculation Errors:**
- If using software, confirm that the correct function was input. Check settings for graphing mode (degree/radian, domain restrictions, etc.).
By following the steps above, the student can identify and correct the errors in their original graph to ensure it correctly represents the intended mathematical function or scenario.
Expert Solution
Step 1

Step by step
Solved in 3 steps with 3 images

Recommended textbooks for you

Calculus: Early Transcendentals
Calculus
ISBN:
9781285741550
Author:
James Stewart
Publisher:
Cengage Learning

Thomas' Calculus (14th Edition)
Calculus
ISBN:
9780134438986
Author:
Joel R. Hass, Christopher E. Heil, Maurice D. Weir
Publisher:
PEARSON

Calculus: Early Transcendentals (3rd Edition)
Calculus
ISBN:
9780134763644
Author:
William L. Briggs, Lyle Cochran, Bernard Gillett, Eric Schulz
Publisher:
PEARSON

Calculus: Early Transcendentals
Calculus
ISBN:
9781285741550
Author:
James Stewart
Publisher:
Cengage Learning

Thomas' Calculus (14th Edition)
Calculus
ISBN:
9780134438986
Author:
Joel R. Hass, Christopher E. Heil, Maurice D. Weir
Publisher:
PEARSON

Calculus: Early Transcendentals (3rd Edition)
Calculus
ISBN:
9780134763644
Author:
William L. Briggs, Lyle Cochran, Bernard Gillett, Eric Schulz
Publisher:
PEARSON

Calculus: Early Transcendentals
Calculus
ISBN:
9781319050740
Author:
Jon Rogawski, Colin Adams, Robert Franzosa
Publisher:
W. H. Freeman


Calculus: Early Transcendental Functions
Calculus
ISBN:
9781337552516
Author:
Ron Larson, Bruce H. Edwards
Publisher:
Cengage Learning