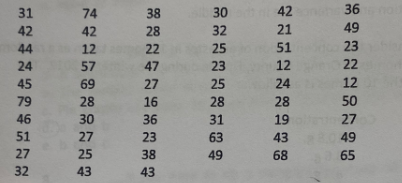
1. The following are stalk lengths in inches of a first generation population developed as a result of inbreeding experiments conducted on giant corn species with dwarf corn species. 31 74 38 30 42 36 42 42 28 32 21 49 44 12 22 25 51 23 24 57 47 23 12 22 algme 45 69 27 25 24 12 79 28 16 28 28 50 46 30 36 31 19 27 51 27 23 63 43 49 27 25 38 49 68 65 32 43 43 struct a frequency distribution and a relative frequency Distribution. (ponts)
1. The following are stalk lengths in inches of a first generation population developed as a result of inbreeding experiments conducted on giant corn species with dwarf corn species. 31 74 38 30 42 36 42 42 28 32 21 49 44 12 22 25 51 23 24 57 47 23 12 22 algme 45 69 27 25 24 12 79 28 16 28 28 50 46 30 36 31 19 27 51 27 23 63 43 49 27 25 38 49 68 65 32 43 43 struct a frequency distribution and a relative frequency Distribution. (ponts)
MATLAB: An Introduction with Applications
6th Edition
ISBN:9781119256830
Author:Amos Gilat
Publisher:Amos Gilat
Chapter1: Starting With Matlab
Section: Chapter Questions
Problem 1P
Related questions
Question

Transcribed Image Text:**Section II: Problems**
**Instructions:** Show all work. If work is not shown, credit will not be given.
**Problem 1:**
The following are stalk lengths in inches of a first-generation population of corn developed as a result of inbreeding experiments conducted on giant corn species crossed with dwarf corn species.
Data:
```
31, 74, 38, 30, 42, 36,
42, 42, 28, 32, 21, 49,
44, 12, 22, 25, 51, 23,
24, 57, 47, 39, 20, 17,
45, 69, 27, 25, 24, 12,
79, 28, 16, 28, 28, 50,
46, 30, 36, 37, 19, 33,
51, 27, 23, 63, 43, 49,
32, 27, 23, 49, 68, 65,
32, 43, 43
```
**Task:**
Construct a frequency distribution and a relative frequency distribution.
**Diagram:**
- **Table Layout:** Two columns titled "Class Interval" and "Frequency."
- There are no entries filled in the table. You will need to determine class intervals and fill in the frequency according to the data provided.
Expert Solution
Step 1
Given :

Trending now
This is a popular solution!
Step by step
Solved in 2 steps with 1 images

Recommended textbooks for you

MATLAB: An Introduction with Applications
Statistics
ISBN:
9781119256830
Author:
Amos Gilat
Publisher:
John Wiley & Sons Inc

Probability and Statistics for Engineering and th…
Statistics
ISBN:
9781305251809
Author:
Jay L. Devore
Publisher:
Cengage Learning

Statistics for The Behavioral Sciences (MindTap C…
Statistics
ISBN:
9781305504912
Author:
Frederick J Gravetter, Larry B. Wallnau
Publisher:
Cengage Learning

MATLAB: An Introduction with Applications
Statistics
ISBN:
9781119256830
Author:
Amos Gilat
Publisher:
John Wiley & Sons Inc

Probability and Statistics for Engineering and th…
Statistics
ISBN:
9781305251809
Author:
Jay L. Devore
Publisher:
Cengage Learning

Statistics for The Behavioral Sciences (MindTap C…
Statistics
ISBN:
9781305504912
Author:
Frederick J Gravetter, Larry B. Wallnau
Publisher:
Cengage Learning

Elementary Statistics: Picturing the World (7th E…
Statistics
ISBN:
9780134683416
Author:
Ron Larson, Betsy Farber
Publisher:
PEARSON

The Basic Practice of Statistics
Statistics
ISBN:
9781319042578
Author:
David S. Moore, William I. Notz, Michael A. Fligner
Publisher:
W. H. Freeman

Introduction to the Practice of Statistics
Statistics
ISBN:
9781319013387
Author:
David S. Moore, George P. McCabe, Bruce A. Craig
Publisher:
W. H. Freeman