.1 0.2 0.3 0.4 0.5 0.0178 0.06 0.122 0.201 0.297 a between ne of particular th area e (x)) dx f(x)) dx. 3. The data in the table show the amount of wealth dis- tributed within a population. ealth, the ld be no dif- enz function able distribu 0.6 0.7 0.8 0.9 0.409 0.536 0.677 0.833 Use regression to determine a power function that best fits these data. (Note: Entering the point (0,0)
.1 0.2 0.3 0.4 0.5 0.0178 0.06 0.122 0.201 0.297 a between ne of particular th area e (x)) dx f(x)) dx. 3. The data in the table show the amount of wealth dis- tributed within a population. ealth, the ld be no dif- enz function able distribu 0.6 0.7 0.8 0.9 0.409 0.536 0.677 0.833 Use regression to determine a power function that best fits these data. (Note: Entering the point (0,0)

MATLAB: An Introduction with Applications
6th Edition
ISBN:9781119256830
Author:Amos Gilat
Publisher:Amos Gilat
Chapter1: Starting With Matlab
Section: Chapter Questions
Problem 1P

Related questions
Question

Transcribed Image Text:In the figure that
ented by the formula
x 0.1
y 0.0178
the area between
is the line of
for a particular
ngle with area
t can be
(x - f(x)) dx
(¹²)
-1
(x -f(x)) dx.
0.2
0.3
0.4
0.5
0.6
0.7
0.8
0.9
0.06 0.122 0.201 0.297 0.409 0.536 0.677 0.833
on of wealth, the
re would be no dif-
he Lorenz function
inequitable distribu-
ould be 1. Often, the
o give the Gini
a Gini index of 34.
a country is given
h is owned by 60%
value will be
EXERCISES
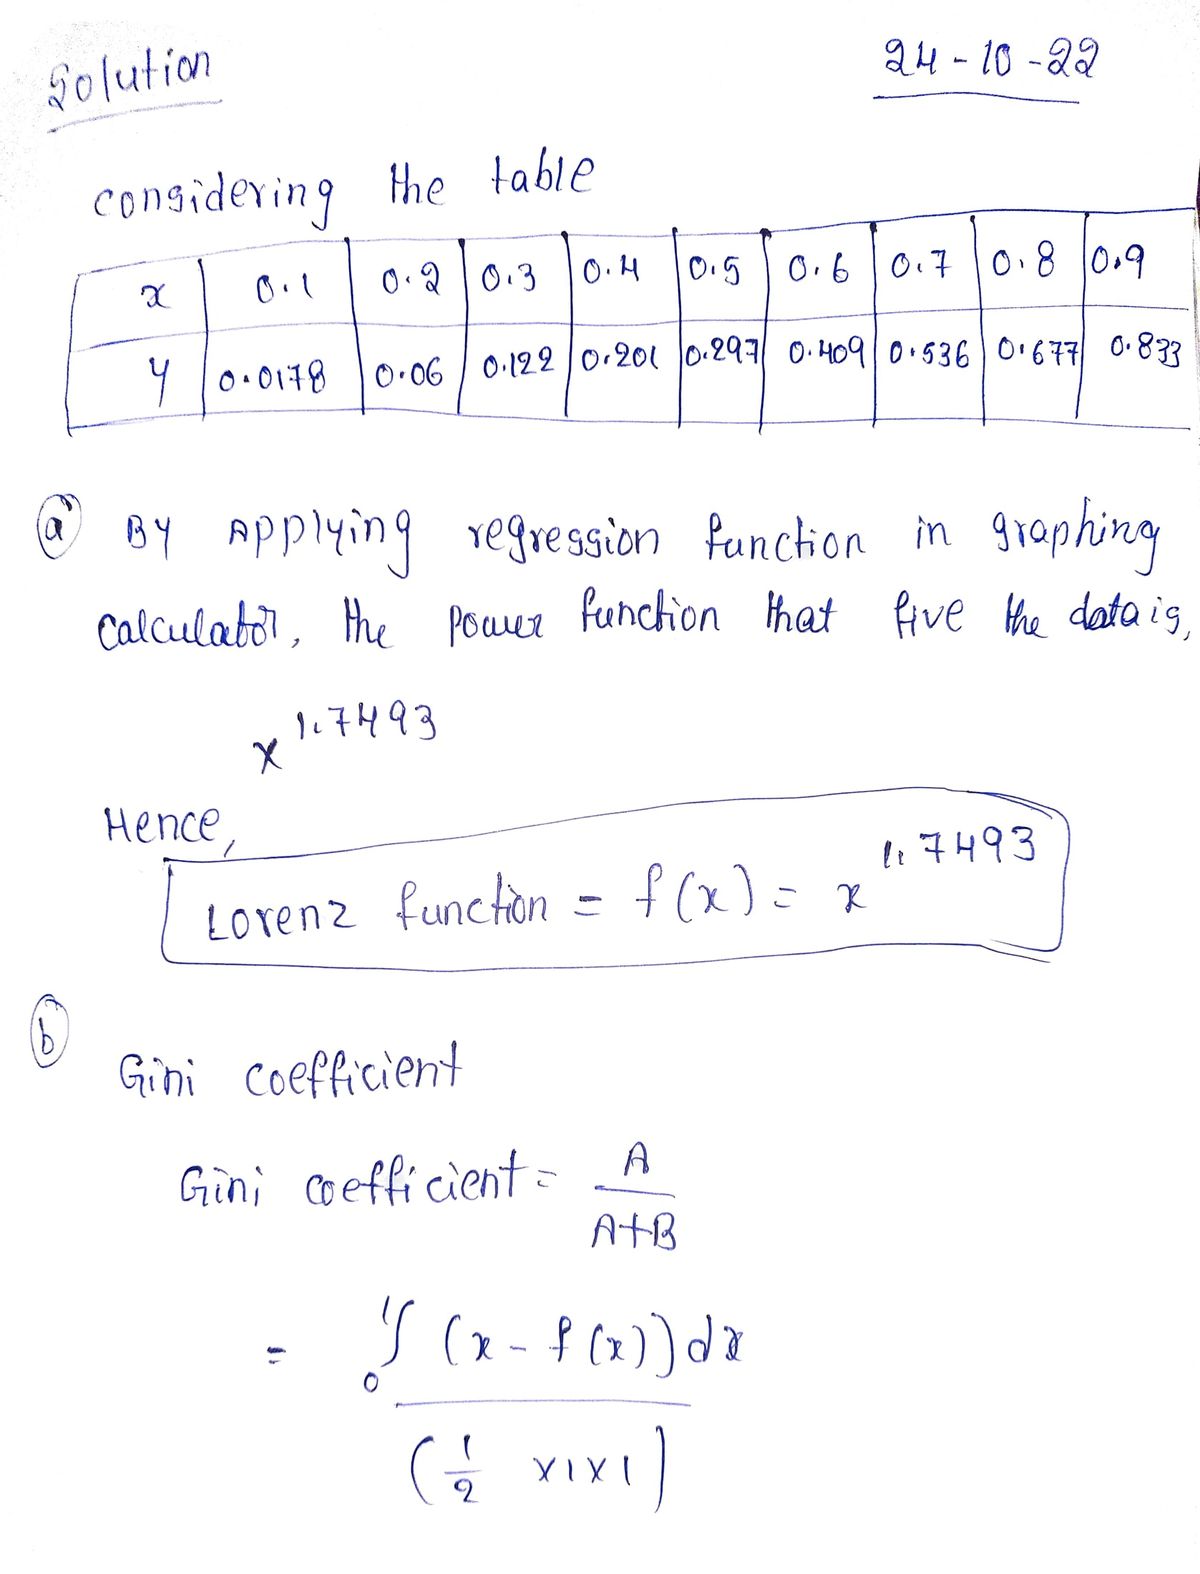
3. The data in the table show the amount of wealth dis-
tributed within a population.
Use regression to determine a power function that
best fits these data. (Note: Entering the point (0, 0)
may cause an error message to appear. However, the
point (1, 1) should be entered along with the rest of
the data.)
a) Express the Lorenz function in the form
f(x)=x". The coefficient should be 1, so you
may have to do some rounding.
b) Determine the Gini coefficient and the Gini
index.
c) What percentage of the wealth is owned by the
lowest 74% of this population?
Expert Solution
Step 1

Step by step
Solved in 2 steps with 2 images

Recommended textbooks for you
MATLAB: An Introduction with Applications
Statistics
ISBN:
9781119256830
Author:
Amos Gilat
Publisher:
John Wiley & Sons Inc

Probability and Statistics for Engineering and th…
Statistics
ISBN:
9781305251809
Author:
Jay L. Devore
Publisher:
Cengage Learning

Statistics for The Behavioral Sciences (MindTap C…
Statistics
ISBN:
9781305504912
Author:
Frederick J Gravetter, Larry B. Wallnau
Publisher:
Cengage Learning
MATLAB: An Introduction with Applications
Statistics
ISBN:
9781119256830
Author:
Amos Gilat
Publisher:
John Wiley & Sons Inc
Probability and Statistics for Engineering and th…
Statistics
ISBN:
9781305251809
Author:
Jay L. Devore
Publisher:
Cengage Learning
Statistics for The Behavioral Sciences (MindTap C…
Statistics
ISBN:
9781305504912
Author:
Frederick J Gravetter, Larry B. Wallnau
Publisher:
Cengage Learning

Elementary Statistics: Picturing the World (7th E…
Statistics
ISBN:
9780134683416
Author:
Ron Larson, Betsy Farber
Publisher:
PEARSON

The Basic Practice of Statistics
Statistics
ISBN:
9781319042578
Author:
David S. Moore, William I. Notz, Michael A. Fligner
Publisher:
W. H. Freeman

Introduction to the Practice of Statistics
Statistics
ISBN:
9781319013387
Author:
David S. Moore, George P. McCabe, Bruce A. Craig
Publisher:
W. H. Freeman