
The Earth–Sun orientation will change throughout the year as Earth revolves around the Sun. Using Figures 2-3 and 2-4 as models, sketch two similar diagrams for each date given to the right and below. First draw Earth’s axis and equator on the globe. Then, on the “sunny side” of the globe, draw a short line representing a flat surface at 66.5° N, 30° N, 0°, and 23.5° S, a stick figure at each site with the Sun’s rays striking the flat surface at the feet of the stick figure. On the profile view, draw the Sun’s rays striking the flat surface transcribing the angles that you drew on the globe.
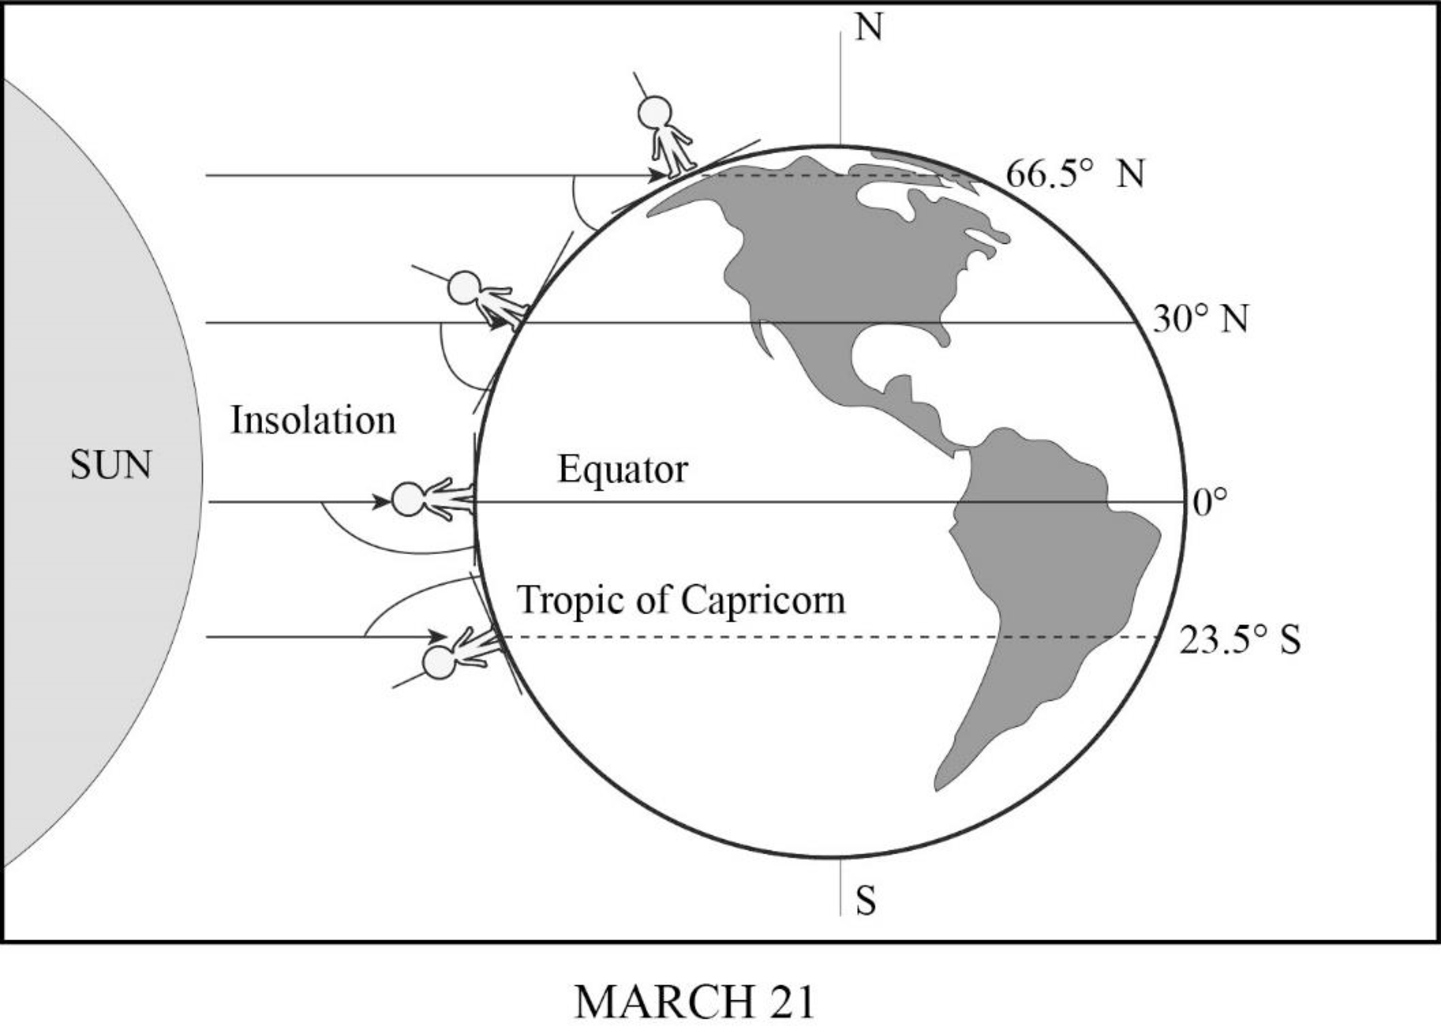
Sun’s rays striking Earth on March 21.
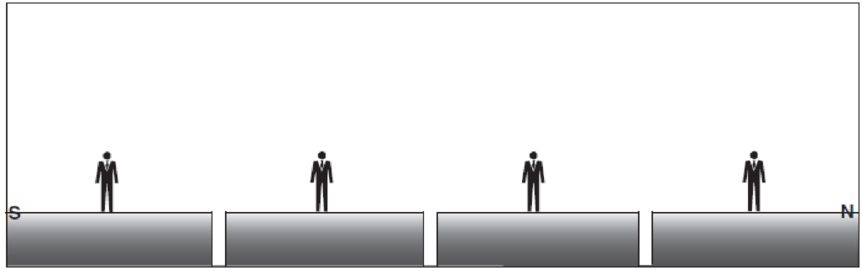
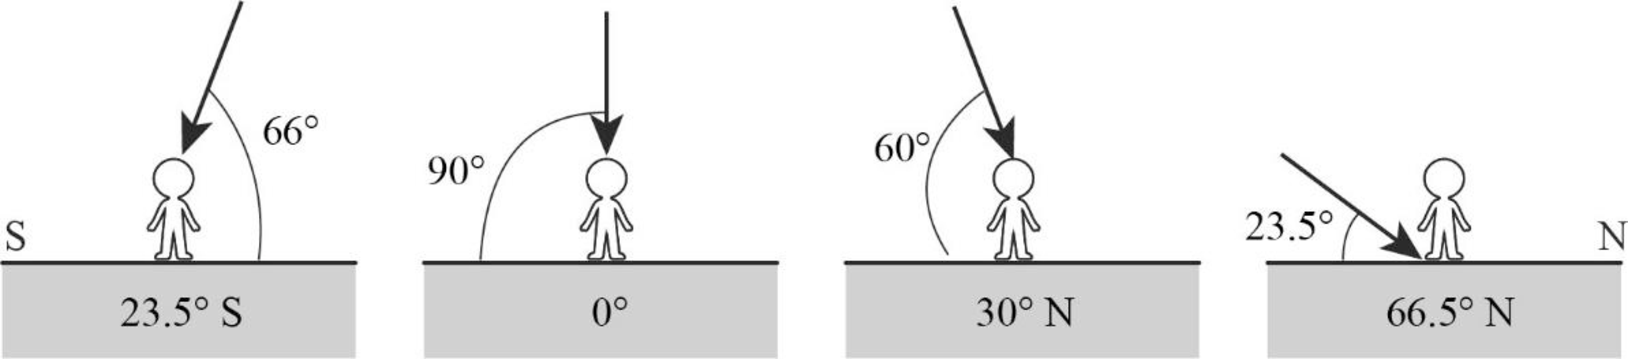
Profile view at Earth’s surface: solar noon on March 21.
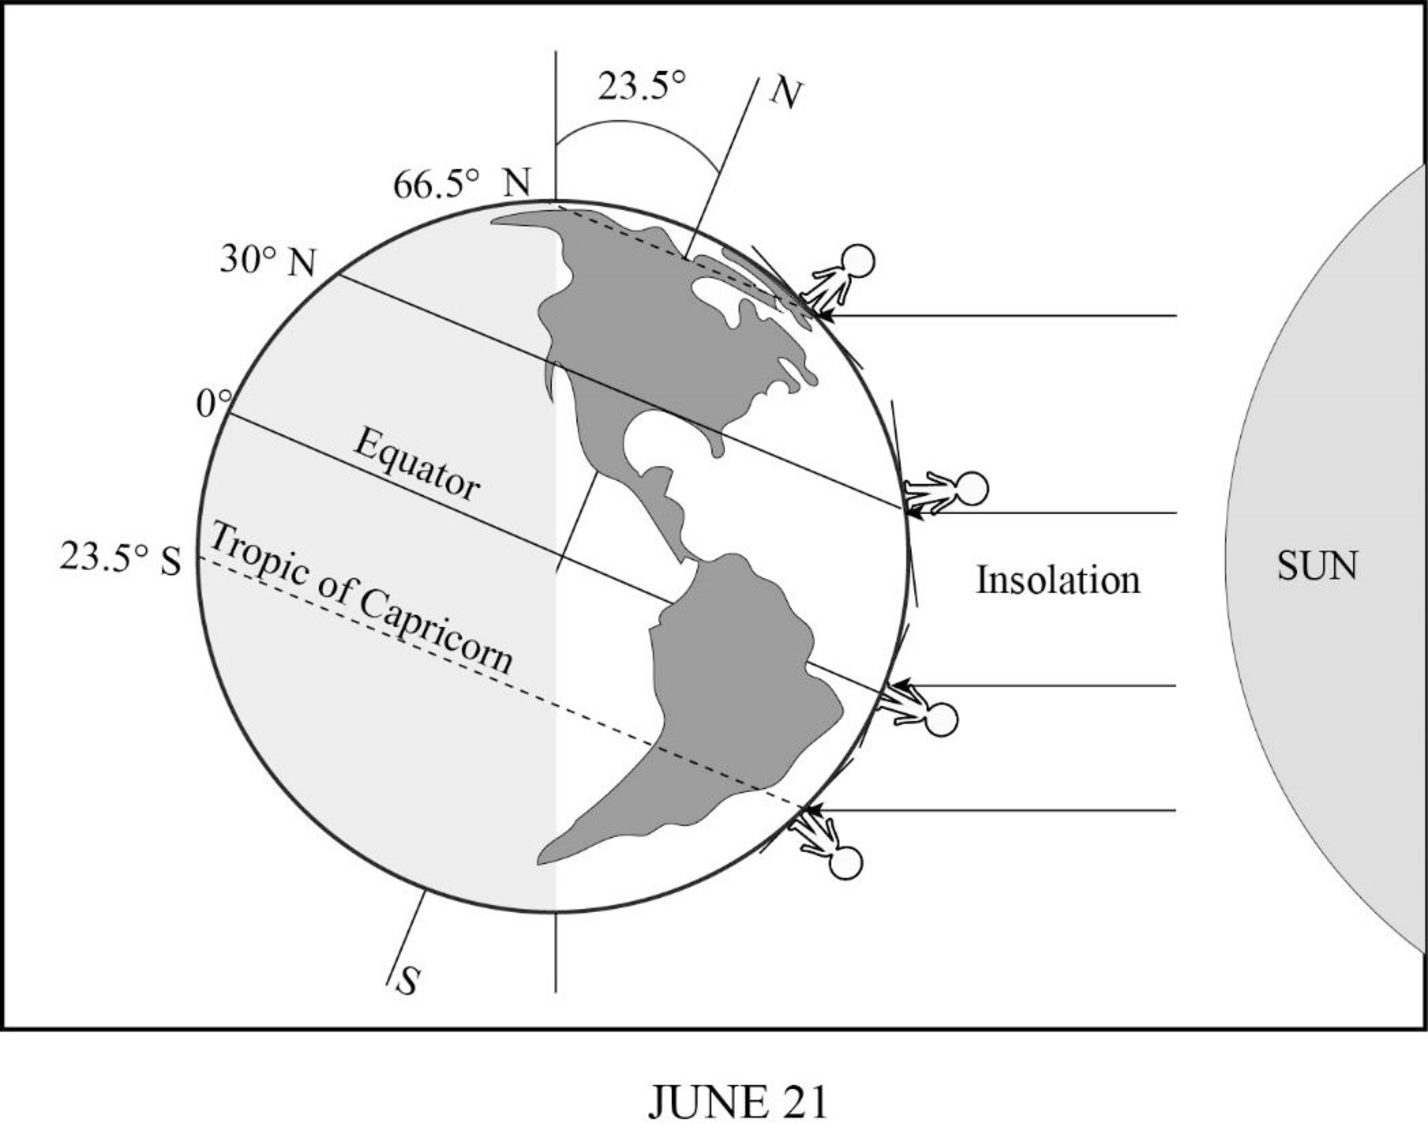
Sun’s rays striking Earth on June 21.
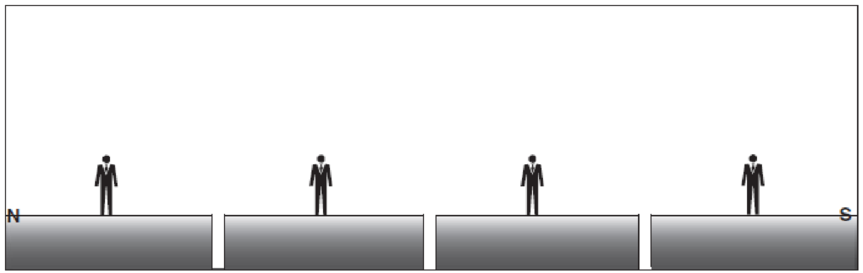
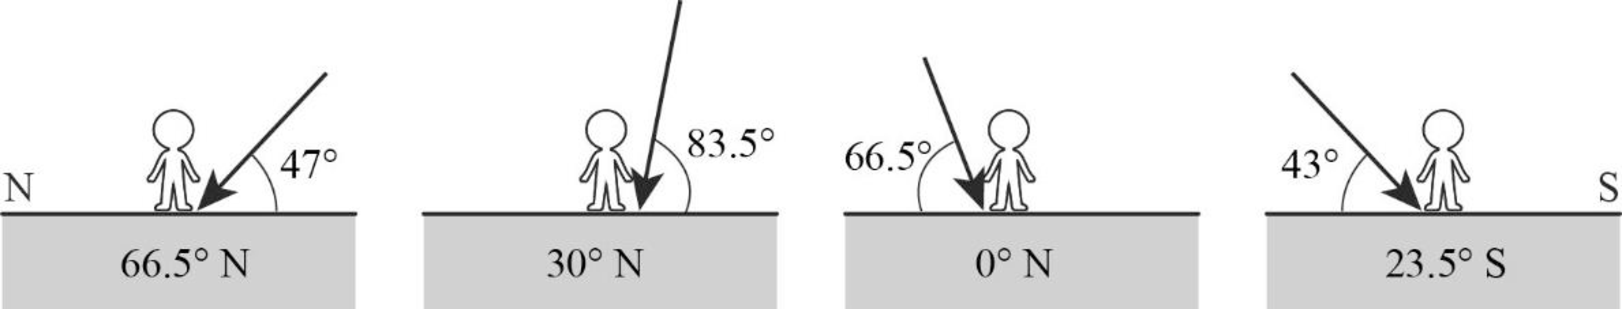
Profile view at Earth’s surface: solar noon on June 21.
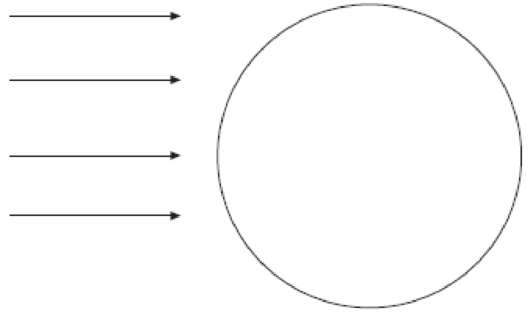
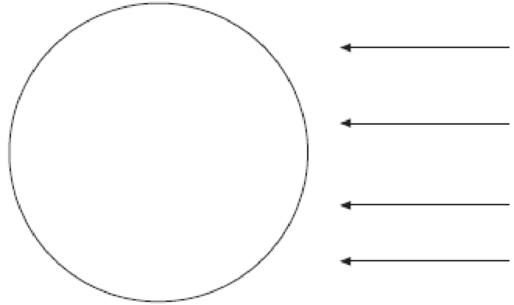
Sketch representation of the incidence of the Sun’s rays on the images given in the question, on March 21 and June 21.
Answer to Problem 1E
On March 21, which is the time of vernal equinox on the Northern Hemisphere and autumn equinox in the Southern Hemisphere, there will be direct incidence of sunlight on the equator as well as on the other latitudes north and south of the equator. The figures given below represent the angle of incidence of insolation on various latitudes.
On June 21, which is the time of Summer Solstice in the Northern Hemisphere, the Sun will be more direct over the Northern Hemisphere, indicating the beginning of Summer season. The North Pole will be inclined at an angle of
Explanation of Solution
On March 21, the Earth exhibits an equinox time. It is generally known as vernal equinox in the Northern hemisphere, while in the Southern Hemisphere, it is known as autumn equinox. During equinox, neither of the poles would be specifically inclined toward the Sun nor would any of the poles be receiving more insolation. Instead, both the hemispheres will experience equal duration of day and night. The insolation might fall on the Earth vertically, which means the equator along with latitudes above and below it receives vertical rays of the Sun.
June 21 is referred to as the June Solstice or Summer Solstice in the Northern Hemisphere. Solstice is the time during which one of the hemispheres will be facing the Sun more directly. During June Solstice, the Earth’s rotation axis over the North Pole is most directed or inclined (by nearly
Want to see more full solutions like this?
Chapter 2 Solutions
Exercises for Weather & Climate (9th Edition)
Additional Science Textbook Solutions
Campbell Essential Biology (7th Edition)
Microbiology with Diseases by Body System (5th Edition)
Human Physiology: An Integrated Approach (8th Edition)
Introductory Chemistry (6th Edition)
Chemistry: An Introduction to General, Organic, and Biological Chemistry (13th Edition)
Campbell Biology (11th Edition)

- Figure 9.9 is a stereogram showing a portion of the area covered by the Whitewater, Wisconsin, topographic map (Figure 9.10, page 160). Use the stereogram and the map to complete the following. (I can only upload two images, so if you have figure 9.9 in Applications and Investigations in Earth Science 9th Edition it would help a lot) 1. After examining the map and stereogram, draw a line on the map to outline the area illustrated on the stereogram. 2. What evidence on the map indicates that portions of the area are poorly drained? On what part of the map are these features located? 3. Use Figure 9.11 to draw a topographic profile of the X-Y line on Figure 9.10. 4. Is the general topography of the land in Sections 7 and 8 in the northwest portion of the region higher or lower in elevation than the land around the letter A located near the center of the map? Is it more or less hilly? 5. Is the area that coincides with Kettle Moraine State Forest higher or lower in elevation than the…arrow_forwardFigure 9.9 is a stereogram showing a portion of the area covered by the Whitewater, Wisconsin, topographic map (Figure 9.10, page 160). Use the stereogram and the map to complete the following. 1. After examining the map and stereogram, draw a line on the map to outline the area illustrated on the stereogram. 2. What evidence on the map indicates that portions of the area are poorly drained? On what part of the map are these features located? 3. Use Figure 9.11 to draw a topographic profile of the X-Y line on Figure 9.10. 4. Is the general topography of the land in Sections 7 and 8 in the northwest portion of the region higher or lower in elevation than the land around the letter A located near the center of the map? Is it more or less hilly? 5. Is the area that coincides with Kettle Moraine State Forest higher or lower in elevation than the land to the northwest and southeast? 6. The feature labeled A on the map is a long ridge composed of till. Is this ridge an esker, an end moraine,…arrow_forwardLab 9: Oceans & Coastal Systems GEOG 1113L – Introduction to Landforms Lab Name: I. How the Coast Works 1. What area is considered the shore? (2 points) 2. Describe the type of area that is required for a beach to form. (4 points) 3. Beaches require constructive waves, which are defined as what? (2 points) 4. What is longshore drift? (3 points) 5. What is the difference between attrition and abrasion? (3 points) 6. What artificial barrier do humans use to protect the coast from high tide? (1 point) 7. What barrier is used to protect against longshore drift? (1 point) II. Coastal Systems This activity can be completed with the use of the USGSarrow_forward
- Low angle subduction of an ocean - continental convergent boundary can can lead toarrow_forward10 complete the map: chat All Bookmarks M Gmail YouTube 1. Select the given image below. It will open the link to a Google Doc. 2. Select FILE -> MAKE A COPY to make your own copy of the concept map. Please do not request edit access of the original document. for you. Please hold on while I c Image created 1 oxygen atom paste google drawing here. is neutral with Pure Water exists in three states on Earth changén state Major Properties high surface tension resulti is neutral 1 oxygen atom chian-tate 0 HH pH of exists in three esists in tiree here" As part of this tools You'll notice that in the bottom left the document says "paste google drawing Submit Cancel na e Consle drawing of a molecule of a types of atoms and the charges The concept map is now c Ask anything + Search B& Darrow_forwarddue today at 2pm, the problems have been done already, is there anyway you can draw the diagrams i was supposed to for each problem because I am confused on how to draw themarrow_forward
- due today at 2pm, the problem have been done already, is there anyway you can draw the diagrams i was supposed to for this because I am confused on how to draw themarrow_forwardTHIS IS DUE AT 2PM TODAY, I JUST NEED HELP WITH THE DRAWINGS THATS IT CAN SOMEONE PLEASE HELP MEarrow_forwardC) A thermometer D A seismometer 23 A student conducted an investigation to determine the effect of water temperature on the amount of sugar that dissolves in a beaker of water. Identify components for trial 1 of this investigation. DRAG & DROP THE ANSWER Note: Use CTRL+D to drag the option via keyboard Constant DV IV Trial 1 Beaker Number Amount of Temperature of Temperature of Amount of Suga Water (mL) Sugar (°C) Water (°C) Dissolved (g) 1 100 20 5 185 2 100 20 10 189 20 15 194 204arrow_forward
- due today at 2pm, the problem have been done already, is there anyway you can draw the diagrams i was supposed to for this because I am confused on how to draw themarrow_forward1. Calculate the elevation of the water table at each well location and write the approximate elevation on the line next to each well. Next, use a colored pencil to draw smooth 10-foot contours that show the shape of the water table. (Start with the 1160-foot contour.) Use a pencil of a different color to draw arrows on the map to indicate the direction of the slope of the water table. a. Toward which direction (downward) does the water table slope? b. Referring to the site of the proposed water well, at approximately what depth below the surface should the proposed well intersect the water table? 2. Assume that a dye was put into well A on May 10, 2017, and detected in well B on May 25, 2018. What was the rate of groundwater movement between the two wells, in centimeters per day? (Hint: Convert feet to centimeters.)Velocity:_____________centimeters per dayarrow_forwardPART 1 Activity 8.7 Ground Subsidence (Figure 8.7) 1. What is the general relationship between ground subsidence and the level of water in the well? 2. What was the total ground subsidence, and what was the total drop in the level of water in the well during the period shown on the graph?Total ground subsidence: —--feetTotal drop in well level: —-- feet 3. During the period shown on the graph, on aver-age, about how much land subsidence occurred with each 20-foot decrease in the water level in the well: 1 foot, 5 feet, or 10 feet?Subsidence: about—----foot/feet 4. Was the ground subsidence that occurred between 1930 and 1950 less or more than the subsidence that occurred between 1950 and 1970?Ground subsidence from 1930 to 1950 was—----than that from 1950 to 1970. 5. Notice that minimal subsidence occurred from 1935 to 1950. Refer to the well water level during the same period of time and suggest a possible reason for the reduced rate of subsidence. PART 2 Activity 8.8 Examining a…arrow_forward
 Applications and Investigations in Earth Science ...Earth ScienceISBN:9780134746241Author:Edward J. Tarbuck, Frederick K. Lutgens, Dennis G. TasaPublisher:PEARSON
 Exercises for Weather & Climate (9th Edition)Earth ScienceISBN:9780134041360Author:Greg CarbonePublisher:PEARSON
 Environmental ScienceEarth ScienceISBN:9781260153125Author:William P Cunningham Prof., Mary Ann Cunningham ProfessorPublisher:McGraw-Hill Education
 Earth Science (15th Edition)Earth ScienceISBN:9780134543536Author:Edward J. Tarbuck, Frederick K. Lutgens, Dennis G. TasaPublisher:PEARSON
 Environmental Science (MindTap Course List)Earth ScienceISBN:9781337569613Author:G. Tyler Miller, Scott SpoolmanPublisher:Cengage Learning
 Physical GeologyEarth ScienceISBN:9781259916823Author:Plummer, Charles C., CARLSON, Diane H., Hammersley, LisaPublisher:Mcgraw-hill Education,