
Decode information from each of the following station models:
Sea-level pressure ___________
Temperature ___________
Dew-point temperature ___________
Sky coverage ___________
Current weather ___________
Sea-level pressure ___________
Temperature ___________
Dew-point temperature ___________
Sky coverage ___________
Wind speed ___________
Wind direction ___________
Pressure change during last three hours ___________
Pressure tendency ___________
Sea-level pressure ___________
Temperature ___________
Dew-point temperature ___________
Sky coverage ___________
(a)
Decode information from each of the following station models:
Answer to Problem 1E
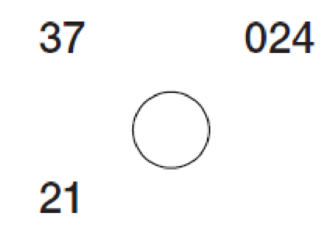
Sea-level pressure 1002.4 mb
Temperature 37⁰ F
Dew-point temperature 21⁰ F
Sky coverage CLEAR
Explanation of Solution
The given diagram represents an area with sea-level pressure 1002.4 mb. Temperature 37⁰ F, dew-point temperature with clear sky coverage. Values are identified using reference symbols given in the weather map lab analysis material.
(b)
Decode information from each of the following station models:
Answer to Problem 1E
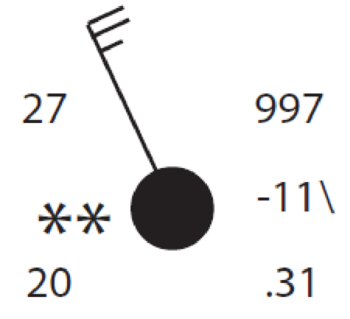
Current weather CONTINUOUS LIGHT SNOW
Sea-level pressure 999.7 mb
Temperature 27⁰ F
Dew-point temperature 20⁰ F
Sky coverage OVERCAST
Wind speed 23-27 KNOTS
Wind direction NORTH WEST
Pressure change
during last three hours 1.1 mb
Pressure tendency FALLING
Explanation of Solution
The given diagram represents an area with sea-level pressure 999.7 mb. Temperature 27⁰ F, dew-point temperature 20⁰ F with cloudy sky. The current weather of the area is continuous light snow. This weather represents a dry, windy conditions of the area because of high wind, low temperature and dew point temperature. Chances of rain are expected due to falling pressure. Values are identified using reference symbols given in the weather map lab analysis material.
(c)
Decode information from each of the following station models:
Answer to Problem 1E
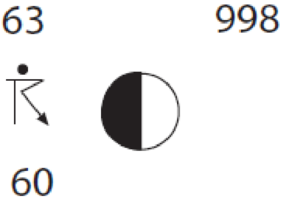
Sea-level pressure 999.8 mb
Temperature 63⁰ F
Dew-point temperature 60⁰ F
Sky coverage PARTLY CLOUDY
Current weather THUNDER WITH LIGHT RAIN
Explanation of Solution
The given diagram represents an area with sea-level pressure 999.8 mb. Temperature 63⁰ F, dew-point temperature 60⁰ F with partly cloudy sky. The current weather of the area is light rain with thunderstorms. Values are identified using reference symbols given in the weather map lab analysis material.
Want to see more full solutions like this?
Chapter 9 Solutions
Exercises for Weather & Climate (9th Edition)
Additional Science Textbook Solutions
Biology: Life on Earth with Physiology (11th Edition)
Microbiology: An Introduction
Human Physiology: An Integrated Approach (8th Edition)
Introductory Chemistry (6th Edition)
The Cosmic Perspective (8th Edition)
Physics for Scientists and Engineers: A Strategic Approach, Vol. 1 (Chs 1-21) (4th Edition)

- Figure 9.9 is a stereogram showing a portion of the area covered by the Whitewater, Wisconsin, topographic map (Figure 9.10, page 160). Use the stereogram and the map to complete the following. 7. The streamlined, asymmetrical hills composed of till, labeled B, are what type of feature? 8. Examine the shape of the features labeled B on the map in Figure 9.10. How can these features be used to determine the direction of ice flow in a glaciated area? 9. Using the features labeled B in Figure 9.10 as a guide, draw an arrow on the map to indicate the direction of ice movement that occurred in this region. 10. What is the likely location of the outwash plain on the map? Identify and label the area "outwash plain." (Hint: Refer to Figure 9.7.) 11. Label the area covered by ground moraine. 12. What term is applied to the numerous almost circular depressions designated with the letter C?arrow_forwardFigure 9.9 is a stereogram showing a portion of the area covered by the Whitewater, Wisconsin, topographic map (Figure 9.10, page 160). Use the stereogram and the map to complete the following. (I can only upload two images, so if you have figure 9.9 in Applications and Investigations in Earth Science 9th Edition it would help a lot) 1. After examining the map and stereogram, draw a line on the map to outline the area illustrated on the stereogram. 2. What evidence on the map indicates that portions of the area are poorly drained? On what part of the map are these features located? 3. Use Figure 9.11 to draw a topographic profile of the X-Y line on Figure 9.10. 4. Is the general topography of the land in Sections 7 and 8 in the northwest portion of the region higher or lower in elevation than the land around the letter A located near the center of the map? Is it more or less hilly? 5. Is the area that coincides with Kettle Moraine State Forest higher or lower in elevation than the…arrow_forwardFigure 9.9 is a stereogram showing a portion of the area covered by the Whitewater, Wisconsin, topographic map (Figure 9.10, page 160). Use the stereogram and the map to complete the following. 1. After examining the map and stereogram, draw a line on the map to outline the area illustrated on the stereogram. 2. What evidence on the map indicates that portions of the area are poorly drained? On what part of the map are these features located? 3. Use Figure 9.11 to draw a topographic profile of the X-Y line on Figure 9.10. 4. Is the general topography of the land in Sections 7 and 8 in the northwest portion of the region higher or lower in elevation than the land around the letter A located near the center of the map? Is it more or less hilly? 5. Is the area that coincides with Kettle Moraine State Forest higher or lower in elevation than the land to the northwest and southeast? 6. The feature labeled A on the map is a long ridge composed of till. Is this ridge an esker, an end moraine,…arrow_forward
- Lab 9: Oceans & Coastal Systems GEOG 1113L – Introduction to Landforms Lab Name: I. How the Coast Works 1. What area is considered the shore? (2 points) 2. Describe the type of area that is required for a beach to form. (4 points) 3. Beaches require constructive waves, which are defined as what? (2 points) 4. What is longshore drift? (3 points) 5. What is the difference between attrition and abrasion? (3 points) 6. What artificial barrier do humans use to protect the coast from high tide? (1 point) 7. What barrier is used to protect against longshore drift? (1 point) II. Coastal Systems This activity can be completed with the use of the USGSarrow_forwardLow angle subduction of an ocean - continental convergent boundary can can lead toarrow_forward10 complete the map: chat All Bookmarks M Gmail YouTube 1. Select the given image below. It will open the link to a Google Doc. 2. Select FILE -> MAKE A COPY to make your own copy of the concept map. Please do not request edit access of the original document. for you. Please hold on while I c Image created 1 oxygen atom paste google drawing here. is neutral with Pure Water exists in three states on Earth changén state Major Properties high surface tension resulti is neutral 1 oxygen atom chian-tate 0 HH pH of exists in three esists in tiree here" As part of this tools You'll notice that in the bottom left the document says "paste google drawing Submit Cancel na e Consle drawing of a molecule of a types of atoms and the charges The concept map is now c Ask anything + Search B& Darrow_forward
- due today at 2pm, the problems have been done already, is there anyway you can draw the diagrams i was supposed to for each problem because I am confused on how to draw themarrow_forwarddue today at 2pm, the problem have been done already, is there anyway you can draw the diagrams i was supposed to for this because I am confused on how to draw themarrow_forwardTHIS IS DUE AT 2PM TODAY, I JUST NEED HELP WITH THE DRAWINGS THATS IT CAN SOMEONE PLEASE HELP MEarrow_forward
- C) A thermometer D A seismometer 23 A student conducted an investigation to determine the effect of water temperature on the amount of sugar that dissolves in a beaker of water. Identify components for trial 1 of this investigation. DRAG & DROP THE ANSWER Note: Use CTRL+D to drag the option via keyboard Constant DV IV Trial 1 Beaker Number Amount of Temperature of Temperature of Amount of Suga Water (mL) Sugar (°C) Water (°C) Dissolved (g) 1 100 20 5 185 2 100 20 10 189 20 15 194 204arrow_forwarddue today at 2pm, the problem have been done already, is there anyway you can draw the diagrams i was supposed to for this because I am confused on how to draw themarrow_forward1. Calculate the elevation of the water table at each well location and write the approximate elevation on the line next to each well. Next, use a colored pencil to draw smooth 10-foot contours that show the shape of the water table. (Start with the 1160-foot contour.) Use a pencil of a different color to draw arrows on the map to indicate the direction of the slope of the water table. a. Toward which direction (downward) does the water table slope? b. Referring to the site of the proposed water well, at approximately what depth below the surface should the proposed well intersect the water table? 2. Assume that a dye was put into well A on May 10, 2017, and detected in well B on May 25, 2018. What was the rate of groundwater movement between the two wells, in centimeters per day? (Hint: Convert feet to centimeters.)Velocity:_____________centimeters per dayarrow_forward
 Applications and Investigations in Earth Science ...Earth ScienceISBN:9780134746241Author:Edward J. Tarbuck, Frederick K. Lutgens, Dennis G. TasaPublisher:PEARSON
 Exercises for Weather & Climate (9th Edition)Earth ScienceISBN:9780134041360Author:Greg CarbonePublisher:PEARSON
 Environmental ScienceEarth ScienceISBN:9781260153125Author:William P Cunningham Prof., Mary Ann Cunningham ProfessorPublisher:McGraw-Hill Education
 Earth Science (15th Edition)Earth ScienceISBN:9780134543536Author:Edward J. Tarbuck, Frederick K. Lutgens, Dennis G. TasaPublisher:PEARSON
 Environmental Science (MindTap Course List)Earth ScienceISBN:9781337569613Author:G. Tyler Miller, Scott SpoolmanPublisher:Cengage Learning
 Physical GeologyEarth ScienceISBN:9781259916823Author:Plummer, Charles C., CARLSON, Diane H., Hammersley, LisaPublisher:Mcgraw-hill Education,