Concept explainers
Videos
The graph below, called a
From the graph, it appears that the data follow a linear relation.
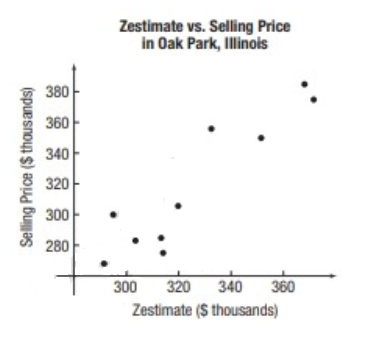
Imagine drawing a line through the data that appears to fit the data well. Do you believe the slope of the line would be positive, negative, or close to zero? Why?
The slope of the line would be positive, negative, or close to zero with reason, by imagine drawing a line through the data that appears to fit the data well.
Answer to Problem 1CP
Solution:
The line passing through the points on scatter plot is slant upward, so the slope of the line would be positive.
Explanation of Solution
Given information:
The data below show the “zestimate”-the selling price of a home as predicted by the folks at Zillow and the actual selling price of the home, for the home in Oak Park Illinois.
The graph below, called a scatter diagram, shows the points

Explanation:
It is observed that, line passing through the points on scatter plot is slant upward.
It is known that, when the slope of the line is positive, the line slants upward.
When the slope of the line is negative, the line slants downward.
When the slope of the line is zero, the line is horizontal.
When the slope of the line is undefined, the line is vertical.
The line passing through the points on scatter plot is slant upward, so the slope of the line would be positive.
Want to see more full solutions like this?
Chapter F Solutions
Precalculus: Concepts Through Functions, A Unit Circle Approach to Trigonometry (4th Edition)


- Explain the relationship between 12.3.6, (case A of 12.3.6) and 12.3.7arrow_forwardExplain the key points and reasons for the establishment of 12.3.2(integral Test)arrow_forwardUse 12.4.2 to determine whether the infinite series on the right side of equation 12.6.5, 12.6.6 and 12.6.7 converges for every real number x.arrow_forward
- use Corollary 12.6.2 and 12.6.3 to derive 12.6.4,12.6.5, 12.6.6 and 12.6.7arrow_forwardExplain the focus and reasons for establishment of 12.5.1(lim(n->infinite) and sigma of k=0 to n)arrow_forwardExplain the focus and reasons for establishment of 12.5.3 about alternating series. and explain the reason why (sigma k=1 to infinite)(-1)k+1/k = 1/1 - 1/2 + 1/3 - 1/4 + .... converges.arrow_forward
- Explain the key points and reasons for the establishment of 12.3.2(integral Test)arrow_forwardUse identity (1+x+x2+...+xn)*(1-x)=1-xn+1 to derive the result of 12.2.2. Please notice that identity doesn't work when x=1.arrow_forwardExplain the key points and reasons for the establishment of 11.3.2(integral Test)arrow_forward
 Functions and Change: A Modeling Approach to Coll...AlgebraISBN:9781337111348Author:Bruce Crauder, Benny Evans, Alan NoellPublisher:Cengage Learning
 Algebra: Structure And Method, Book 1AlgebraISBN:9780395977224Author:Richard G. Brown, Mary P. Dolciani, Robert H. Sorgenfrey, William L. ColePublisher:McDougal Littell