
Introduction To Statistics And Data Analysis
6th Edition
ISBN: 9781337793612
Author: PECK, Roxy.
Publisher: Cengage Learning,
expand_more
expand_more
format_list_bulleted
Concept explainers
Videos
Textbook Question
Chapter 9.1, Problem 1E
Three different statistics are being considered for estimating a population characteristic. The sampling distributions of the three statistics are shown in the following illustration:
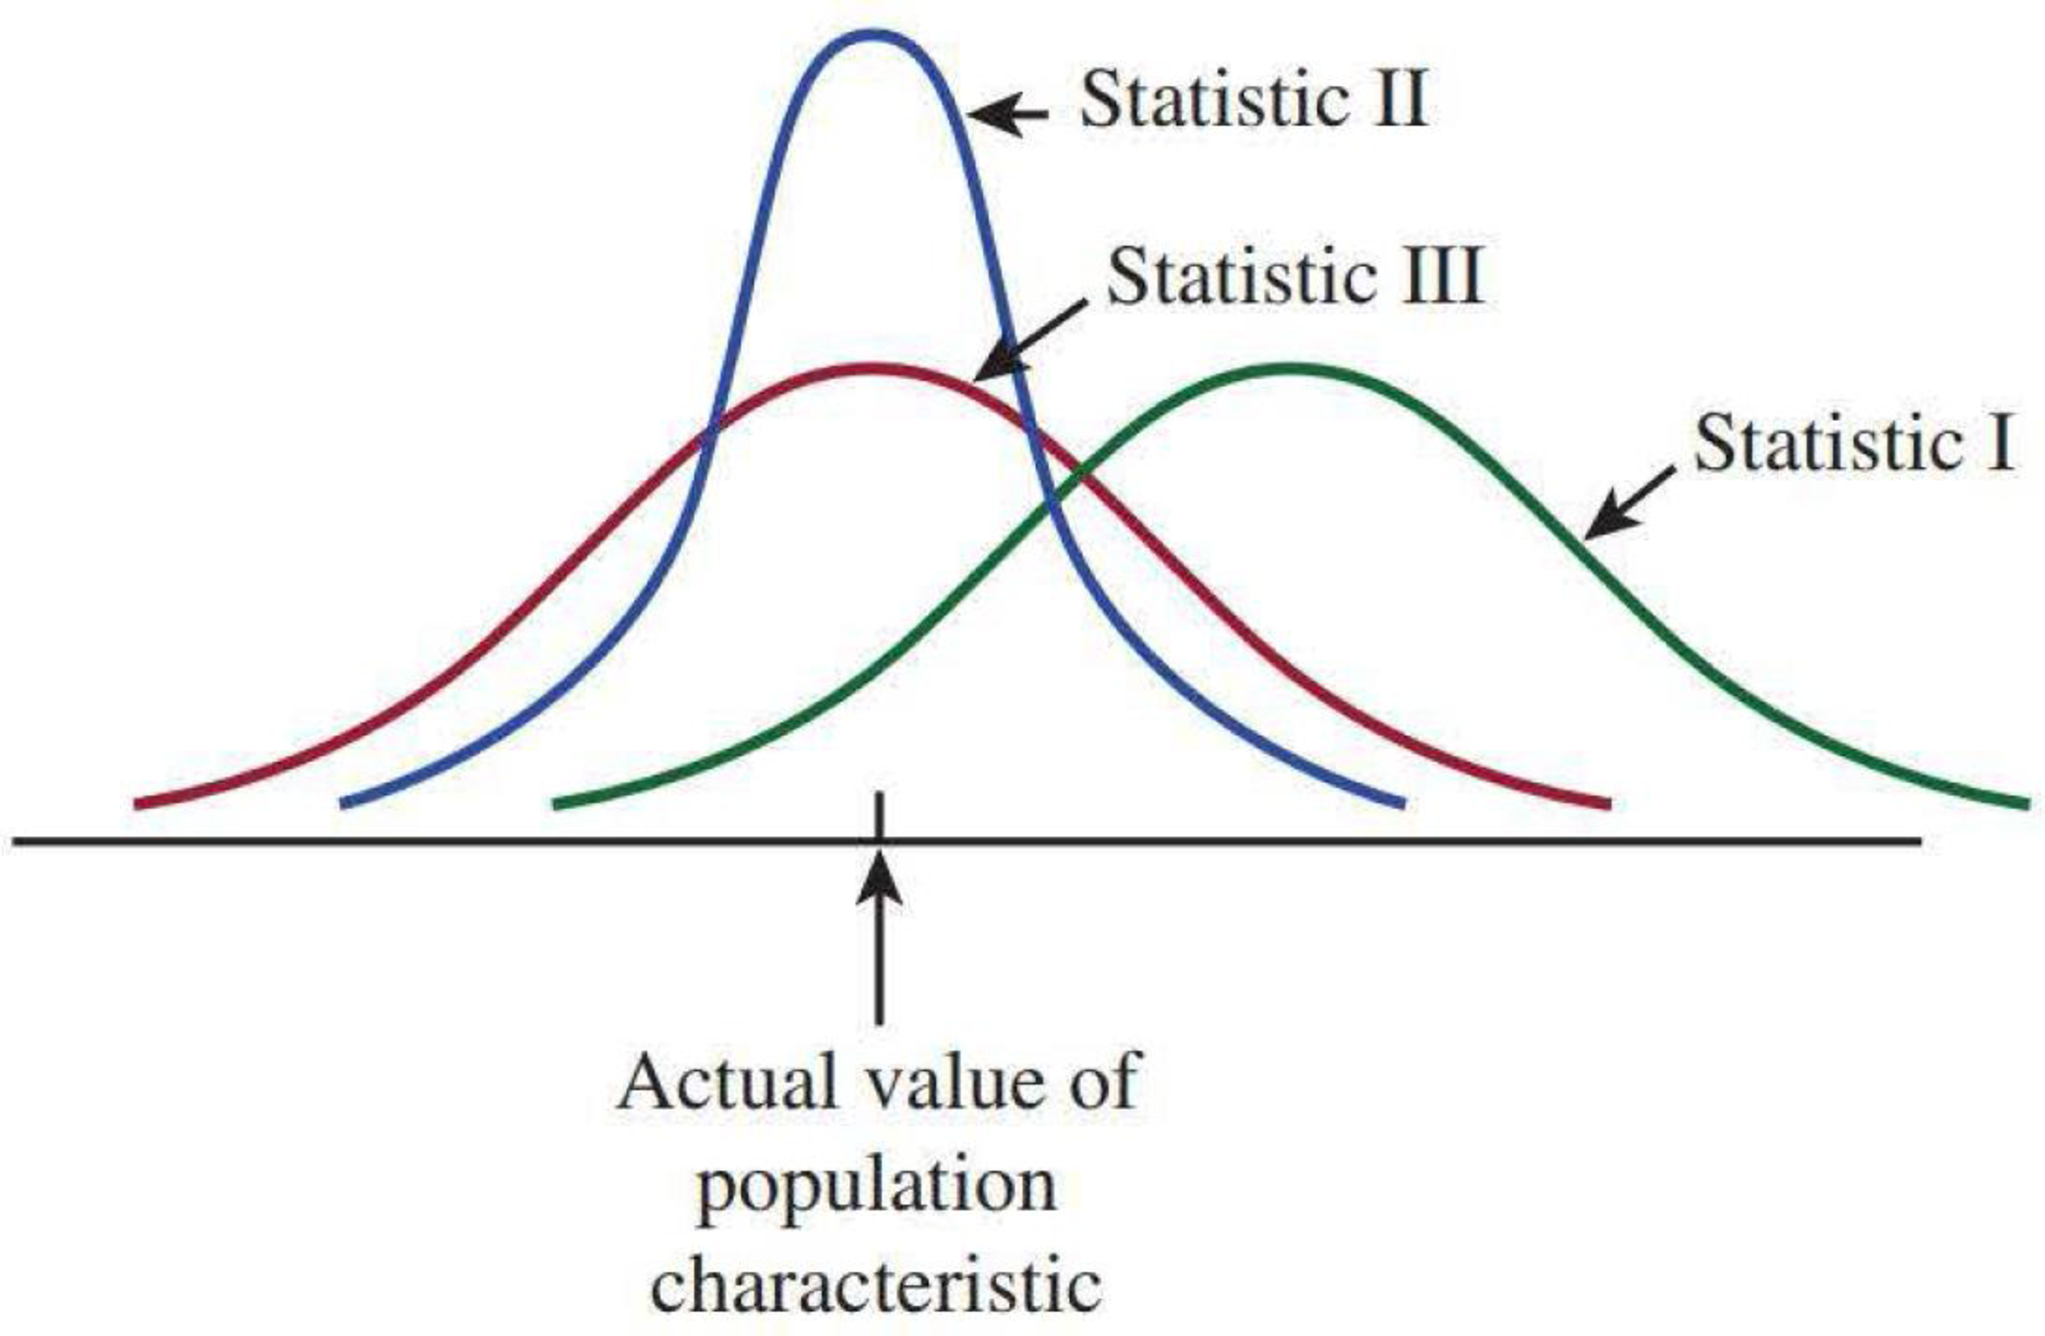
Which statistic would you recommend? Explain your choice. (Hint: See the section on choosing a statistic.)
Expert Solution & Answer

Trending nowThis is a popular solution!

Students have asked these similar questions
Questions
An insurance company's cumulative incurred claims for the last 5 accident years are given
in the following table:
Development Year
Accident Year 0
2018
1 2 3 4
245 267 274 289 292
2019
255 276 288 294
2020
265 283 292
2021
263 278
2022
271
It can be assumed that claims are fully run off after 4 years. The premiums received for
each year are:
Accident Year Premium
2018
306
2019
312
2020
318
2021
326
2022
330
You do not need to make any allowance for inflation.
1. (a) Calculate the reserve at the end of 2022 using the basic chain ladder method.
(b) Calculate the reserve at the end of 2022 using the Bornhuetter-Ferguson method.
2. Comment on the differences in the reserves produced by the methods in Part 1.
A population that is uniformly distributed between a=0and b=10 is given in sample sizes
50( ),
100( ),
250( ),
and
500( ).
Find the sample mean and the sample standard deviations for the given data. Compare your results to the average of means for a sample of size 10, and use the empirical rules to analyze the sampling error. For each sample, also find the standard error of the mean using formula given below.
Standard Error of the
Mean =sigma/Root
Complete the following table with the results from the sampling experiment.
(Round to four decimal places as needed.)
Sample Size
Average of 8 Sample Means
Standard Deviation of 8 Sample Means
Standard Error
50
100
250
500
A survey of
250250
young professionals found that
two dash thirdstwo-thirds
of them use their cell phones primarily for e-mail. Can you conclude statistically that the population proportion who use cell phones primarily for e-mail is less than
0.720.72?
Use a 95% confidence interval.
Question content area bottom
Part 1
The 95% confidence interval is
left bracket nothing comma nothing right bracket0.60820.6082, 0.72510.7251.
As
0.720.72
is
within the limits
of the confidence interval, we
cannot
conclude that the population proportion is less than
0.720.72.
(Use ascending order. Round to four decimal places as needed.)
Chapter 9 Solutions
Introduction To Statistics And Data Analysis
Ch. 9.1 - Three different statistics are being considered...Ch. 9.1 - a. Why is an unbiased statistic generally...Ch. 9.1 - The report The 2016 Consumer Financial Literacy...Ch. 9.1 - The authors of the paper Influence of Biofeedback...Ch. 9.1 - Each person in a random sample of 20 students at a...Ch. 9.1 - Suppose that each of 935 smokers received a...Ch. 9.1 - Given below are the sodium contents (in mg) for...Ch. 9.1 - A random sample of n = 12 four-year-old red pine...Ch. 9.1 - A random sample of 10 houses heated with natural...Ch. 9.2 - Explain which would result in a wider large-sample...
Ch. 9.2 - Explain which would result in a wider large-sample...Ch. 9.2 - The formula used to calculate a large-sample...Ch. 9.2 - The use of the interval p(zcriticalvalue)p(1p)n...Ch. 9.2 - For each of the following combinations of sample...Ch. 9.2 - Discuss how each of the following factors affects...Ch. 9.2 - The USA TODAY Snapshot titled Social Media...Ch. 9.2 - Based on data from a survey of 1200 randomly...Ch. 9.2 - The report Parents, Teens and Digital Monitoring...Ch. 9.2 - If a hurricane was headed your way, would you...Ch. 9.2 - The USA TODAY Snapshot titled Big Bang Theory (USA...Ch. 9.2 - The article Most Dog Owners Take More Pictures of...Ch. 9.2 - The Princeton Review 2016 College Hopes and...Ch. 9.2 - The USA TODAY Snapshot titled Babys First Photo...Ch. 9.2 - The report Job Seeker Nation Study...Ch. 9.2 - USA TODAY reported that the proportion of...Ch. 9.2 - The USA TODAY Snapshot titled Have a Nice Trip...Ch. 9.2 - Business Insider reported that a study...Ch. 9.2 - In 2010, the National Football League adopted new...Ch. 9.2 - The article Most Americans Dont Understand the...Ch. 9.2 - The Gallup Organization conducts an annual survey...Ch. 9.2 - The article Hospitals Dispute Medtronic Data on...Ch. 9.2 - Based on survey of a representative sample of 1000...Ch. 9.2 - A discussion of digital ethics appears in the...Ch. 9.2 - In spite of the potential safety hazards, some...Ch. 9.2 - In 2010, the online security firm Symantec...Ch. 9.3 - Given a variable that has at distribution with the...Ch. 9.3 - The formula used to calculate a confidence...Ch. 9.3 - USA TODAY reported that the average amount of...Ch. 9.3 - Samples of two different models of cars were...Ch. 9.3 - USA TODAY reported that the average amount of...Ch. 9.3 - The paper The Effects of Adolescent Volunteer...Ch. 9.3 - Medical research has shown that repeated wrist...Ch. 9.3 - Students in a representative sample of 65...Ch. 9.3 - The paper referenced in the previous exercise also...Ch. 9.3 - Suppose that a random sample of 50 bottles of a...Ch. 9.3 - The authors of the paper Driving Performance While...Ch. 9.3 - The article The Association Between Television...Ch. 9.3 - The paper Patterns and Composition of Weight...Ch. 9.3 - Because of safety considerations, in May 2003 the...Ch. 9.3 - Example 9.3 gave the following airborne times (in...Ch. 9.3 - Consumer Reports gave the following mileage...Ch. 9.3 - Five students visiting the student health center...Ch. 9.3 - The Bureau of Alcohol, Tobacco, and Firearms...Ch. 9.3 - The formula described in this section for...Ch. 9.4 - The following quote is from the article Credit...Ch. 9.4 - Authors of the news release titled Major Gaps...Ch. 9.4 - The paper The Curious Promiscuity of Queen Honey...Ch. 9.5 - A survey on SodaHead...Ch. 9.5 - Prob. 59ECh. 9.5 - Prob. 60ECh. 9.5 - Prob. 61ECh. 9.5 - Prob. 62ECh. 9.5 - Prob. 63ECh. 9.5 - Prob. 64ECh. 9.5 - Prob. 65ECh. 9.6 - Prob. 66ECh. 9.6 - Prob. 67ECh. 9.6 - Teams in the National Football League (NFL) are...Ch. 9.6 - Prob. 69ECh. 9.6 - The Economist collects data each year on the price...Ch. 9.6 - Major League Baseball (MLB) includes two groups of...Ch. 9 - The article Write It by Hand to Make It Stick...Ch. 9 - Prob. 73CRCh. 9 - The report The 2016 Consumer Financial Literacy...Ch. 9 - The report The Politics of Climate (Pew Research...Ch. 9 - The report referenced in the previous exercise...Ch. 9 - Data from a survey of a representative sample was...Ch. 9 - A manufacturer of small appliances purchases...Ch. 9 - A manufacturer of college textbooks is interested...Ch. 9 - The confidence intervals presented in this chapter...Ch. 9 - Prob. 81CRCh. 9 - The interval from 2.33 to 1.75 captures an area of...
Knowledge Booster


Learn more about
Need a deep-dive on the concept behind this application? Look no further. Learn more about this topic, statistics and related others by exploring similar questions and additional content below.Similar questions
- I need help with this problem and an explanation of the solution for the image described below. (Statistics: Engineering Probabilities)arrow_forwardA survey of 250 young professionals found that two-thirds of them use their cell phones primarily for e-mail. Can you conclude statistically that the population proportion who use cell phones primarily for e-mail is less than 0.72? Use a 95% confidence interval. Question content area bottom Part 1 The 95% confidence interval is [ ], [ ] As 0.72 is ▼ above the upper limit within the limits below the lower limit of the confidence interval, we ▼ can cannot conclude that the population proportion is less than 0.72. (Use ascending order. Round to four decimal places as needed.)arrow_forwardI need help with this problem and an explanation of the solution for the image described below. (Statistics: Engineering Probabilities)arrow_forward
- I need help with this problem and an explanation of the solution for the image described below. (Statistics: Engineering Probabilities)arrow_forwardI need help with this problem and an explanation of the solution for the image described below. (Statistics: Engineering Probabilities)arrow_forwardQuestions An insurance company's cumulative incurred claims for the last 5 accident years are given in the following table: Development Year Accident Year 0 2018 1 2 3 4 245 267 274 289 292 2019 255 276 288 294 2020 265 283 292 2021 263 278 2022 271 It can be assumed that claims are fully run off after 4 years. The premiums received for each year are: Accident Year Premium 2018 306 2019 312 2020 318 2021 326 2022 330 You do not need to make any allowance for inflation. 1. (a) Calculate the reserve at the end of 2022 using the basic chain ladder method. (b) Calculate the reserve at the end of 2022 using the Bornhuetter-Ferguson method. 2. Comment on the differences in the reserves produced by the methods in Part 1.arrow_forward
- Questions An insurance company's cumulative incurred claims for the last 5 accident years are given in the following table: Development Year Accident Year 0 2018 1 2 3 4 245 267 274 289 292 2019 255 276 288 294 2020 265 283 292 2021 263 278 2022 271 It can be assumed that claims are fully run off after 4 years. The premiums received for each year are: Accident Year Premium 2018 306 2019 312 2020 318 2021 326 2022 330 You do not need to make any allowance for inflation. 1. (a) Calculate the reserve at the end of 2022 using the basic chain ladder method. (b) Calculate the reserve at the end of 2022 using the Bornhuetter-Ferguson method. 2. Comment on the differences in the reserves produced by the methods in Part 1.arrow_forwardFrom a sample of 26 graduate students, the mean number of months of work experience prior to entering an MBA program was 34.67. The national standard deviation is known to be18 months. What is a 90% confidence interval for the population mean? Question content area bottom Part 1 A 9090% confidence interval for the population mean is left bracket nothing comma nothing right bracketenter your response here,enter your response here. (Use ascending order. Round to two decimal places as needed.)arrow_forwardA test consists of 10 questions made of 5 answers with only one correct answer. To pass the test, a student must answer at least 8 questions correctly. (a) If a student guesses on each question, what is the probability that the student passes the test? (b) Find the mean and standard deviation of the number of correct answers. (c) Is it unusual for a student to pass the test by guessing? Explain.arrow_forward
- In a group of 40 people, 35% have never been abroad. Two people are selected at random without replacement and are asked about their past travel experience. a. Is this a binomial experiment? Why or why not? What is the probability that in a random sample of 2, no one has been abroad? b. What is the probability that in a random sample of 2, at least one has been abroad?arrow_forwardQuestions An insurance company's cumulative incurred claims for the last 5 accident years are given in the following table: Development Year Accident Year 0 2018 1 2 3 4 245 267 274 289 292 2019 255 276 288 294 2020 265 283 292 2021 263 278 2022 271 It can be assumed that claims are fully run off after 4 years. The premiums received for each year are: Accident Year Premium 2018 306 2019 312 2020 318 2021 326 2022 330 You do not need to make any allowance for inflation. 1. (a) Calculate the reserve at the end of 2022 using the basic chain ladder method. (b) Calculate the reserve at the end of 2022 using the Bornhuetter-Ferguson method. 2. Comment on the differences in the reserves produced by the methods in Part 1.arrow_forwardTo help consumers in purchasing a laptop computer, Consumer Reports calculates an overall test score for each computer tested based upon rating factors such as ergonomics, portability, performance, display, and battery life. Higher overall scores indicate better test results. The following data show the average retail price and the overall score for ten 13-inch models (Consumer Reports website, October 25, 2012). Brand & Model Price ($) Overall Score Samsung Ultrabook NP900X3C-A01US 1250 83 Apple MacBook Air MC965LL/A 1300 83 Apple MacBook Air MD231LL/A 1200 82 HP ENVY 13-2050nr Spectre XT 950 79 Sony VAIO SVS13112FXB 800 77 Acer Aspire S5-391-9880 Ultrabook 1200 74 Apple MacBook Pro MD101LL/A 1200 74 Apple MacBook Pro MD313LL/A 1000 73 Dell Inspiron I13Z-6591SLV 700 67 Samsung NP535U3C-A01US 600 63 a. Select a scatter diagram with price as the independent variable. b. What does the scatter diagram developed in part (a) indicate about the relationship…arrow_forward
arrow_back_ios
SEE MORE QUESTIONS
arrow_forward_ios
Recommended textbooks for you
 Big Ideas Math A Bridge To Success Algebra 1: Stu...AlgebraISBN:9781680331141Author:HOUGHTON MIFFLIN HARCOURTPublisher:Houghton Mifflin Harcourt
 Glencoe Algebra 1, Student Edition, 9780079039897...AlgebraISBN:9780079039897Author:CarterPublisher:McGraw Hill
 Holt Mcdougal Larson Pre-algebra: Student Edition...AlgebraISBN:9780547587776Author:HOLT MCDOUGALPublisher:HOLT MCDOUGAL
Big Ideas Math A Bridge To Success Algebra 1: Stu...
Algebra
ISBN:9781680331141
Author:HOUGHTON MIFFLIN HARCOURT
Publisher:Houghton Mifflin Harcourt
Glencoe Algebra 1, Student Edition, 9780079039897...
Algebra
ISBN:9780079039897
Author:Carter
Publisher:McGraw Hill
Holt Mcdougal Larson Pre-algebra: Student Edition...
Algebra
ISBN:9780547587776
Author:HOLT MCDOUGAL
Publisher:HOLT MCDOUGAL
Correlation Vs Regression: Difference Between them with definition & Comparison Chart; Author: Key Differences;https://www.youtube.com/watch?v=Ou2QGSJVd0U;License: Standard YouTube License, CC-BY
Correlation and Regression: Concepts with Illustrative examples; Author: LEARN & APPLY : Lean and Six Sigma;https://www.youtube.com/watch?v=xTpHD5WLuoA;License: Standard YouTube License, CC-BY