Videos
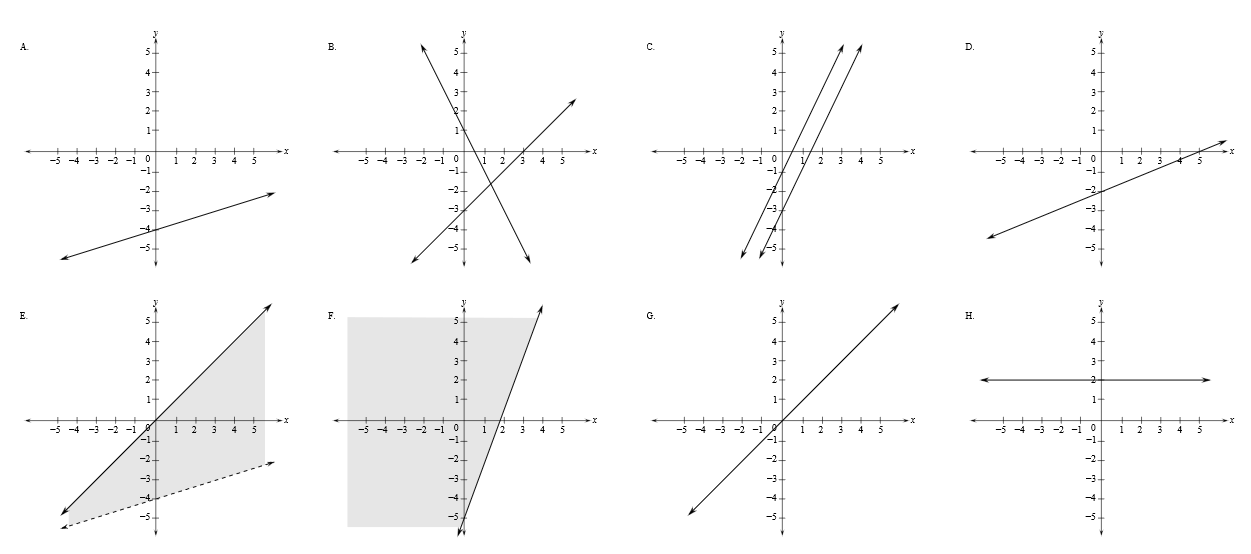
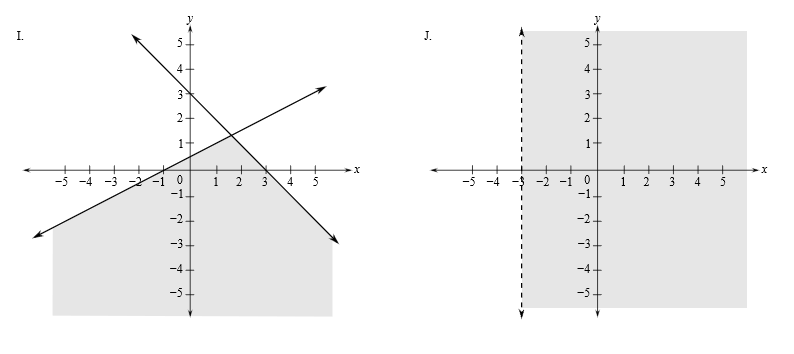
Match each equation, inequality, or system of equations or inequalities with its graph.
The match of the graph of the system of equations
Answer to Problem 1RVS
Solution:
The correct match of the graph for the system of equations
Explanation of Solution
Given information:
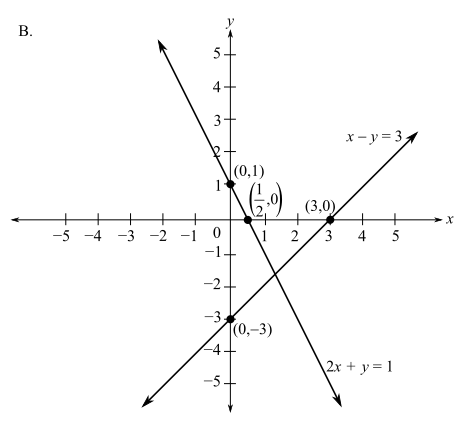
The given system of equations is
The given options of graphs are:
And
The given equations can be plotted on the graph one by one by the following procedure:
Step 1. Considering an equation, first put
Step 2. Now, put
Step 3. Now, join the two points to get the line of the given equation.
For the first equation which is
Put
So, the first point will be
For the second point, put
So, the second point will be
Therefore, the two points for the line
Similarly, for the second line which is
Put
So, the first point will be
For the second point, put
So, the second point will be
Therefore, the two points for the line
The graph for the two equation of lines is given below:
Plot the points
Again, plot the points
That is,
Therefore, the correct match for the graph of the equations
Want to see more full solutions like this?
Chapter 9 Solutions
Elementary and Intermediate Algebra


- 9! is 362, 880. What is 10!?arrow_forward9! is 362, 880. What is 10!?arrow_forwardBruce and Krista are going to buy a new furniture set for their living room. They want to buy a couch, a coffee table, and a recliner. They have narrowed it down so that they are choosing between \[4\] couches, \[5\] coffee tables, and \[9\] recliners. How many different furniture combinations are possible?arrow_forward
- Can you check if my step is correct?arrow_forwardI need help explaining on this example on how can I define the Time-Domain Function, Apply the Laplace Transformation Formula, and Simplify to Find the Frequency-Domain Expression. I need to understand on finding Y(s)arrow_forwardI need help explaining on this example on how can I define the Time-Domain Function, Apply the Laplace Transformation Formula, andarrow_forward
- ma Classes Term. Spring 2025 Title Details Credit Hours CRN Schedule Type Grade Mode Level Date Status Message *MATHEMATICS FOR MANAGEME... MTH 245, 400 4 54835 Online Normal Grading Mode Ecampus Undergradu... 03/21/2025 Registered **Web Registered... *SOIL SCIENCE CSS 205, 400 0 52298 Online Normal Grading Mode Undergraduate 03/21/2025 Waitlisted Waitlist03/21/2025 PLANT PATHOLOGY BOT 451, 400 4 56960 Online Normal Grading Mode Undergraduate 03/21/2025 Registered **Web Registered... Records: 3 Schedule Schedule Detailsarrow_forwardHere is an augmented matrix for a system of equations (three equations and three variables). Let the variables used be x, y, and z: 1 2 4 6 0 1 -1 3 0 0 1 4 Note: that this matrix is already in row echelon form. Your goal is to use this row echelon form to revert back to the equations that this represents, and then to ultimately solve the system of equations by finding x, y and z. Input your answer as a coordinate point: (x,y,z) with no spaces.arrow_forward1 3 -4 In the following matrix perform the operation 2R1 + R2 → R2. -2 -1 6 After you have completed this, what numeric value is in the a22 position?arrow_forward
- 5 -2 0 1 6 12 Let A = 6 7 -1 and B = 1/2 3 -14 -2 0 4 4 4 0 Compute -3A+2B and call the resulting matrix R. If rij represent the individual entries in the matrix R, what numeric value is in 131? Input your answer as a numeric value only.arrow_forward1 -2 4 10 My goal is to put the matrix 5 -1 1 0 into row echelon form using Gaussian elimination. 3 -2 6 9 My next step is to manipulate this matrix using elementary row operations to get a 0 in the a21 position. Which of the following operations would be the appropriate elementary row operation to use to get a 0 in the a21 position? O (1/5)*R2 --> R2 ○ 2R1 + R2 --> R2 ○ 5R1+ R2 --> R2 O-5R1 + R2 --> R2arrow_forwardThe 2x2 linear system of equations -2x+4y = 8 and 4x-3y = 9 was put into the following -2 4 8 augmented matrix: 4 -3 9 This augmented matrix is then converted to row echelon form. Which of the following matrices is the appropriate row echelon form for the given augmented matrix? 0 Option 1: 1 11 -2 Option 2: 4 -3 9 Option 3: 10 ܂ -2 -4 5 25 1 -2 -4 Option 4: 0 1 5 1 -2 Option 5: 0 0 20 -4 5 ○ Option 1 is the appropriate row echelon form. ○ Option 2 is the appropriate row echelon form. ○ Option 3 is the appropriate row echelon form. ○ Option 4 is the appropriate row echelon form. ○ Option 5 is the appropriate row echelon form.arrow_forward
 Algebra: Structure And Method, Book 1AlgebraISBN:9780395977224Author:Richard G. Brown, Mary P. Dolciani, Robert H. Sorgenfrey, William L. ColePublisher:McDougal Littell
 Glencoe Algebra 1, Student Edition, 9780079039897...AlgebraISBN:9780079039897Author:CarterPublisher:McGraw Hill
 College Algebra (MindTap Course List)AlgebraISBN:9781305652231Author:R. David Gustafson, Jeff HughesPublisher:Cengage Learning
 Elementary AlgebraAlgebraISBN:9780998625713Author:Lynn Marecek, MaryAnne Anthony-SmithPublisher:OpenStax - Rice University
 Holt Mcdougal Larson Pre-algebra: Student Edition...AlgebraISBN:9780547587776Author:HOLT MCDOUGALPublisher:HOLT MCDOUGAL