
Elementary Statistics: A Step By Step Approach
9th Edition
ISBN: 9780073534985
Author: Allan Bluman
Publisher: McGraw-Hill Science/Engineering/Math
expand_more
expand_more
format_list_bulleted
Videos
Textbook Question
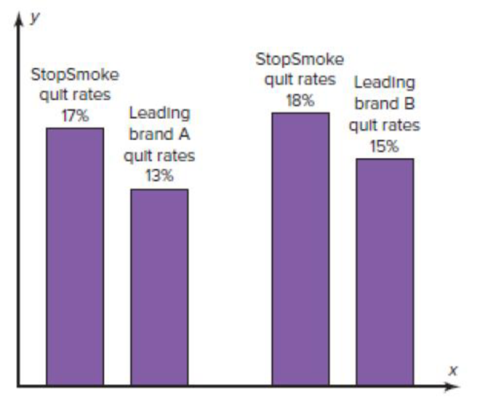
Chapter 8.4, Problem 1AC
What were the statistical hypotheses?
2. What were the null hypotheses?
3. What were the alternative hypotheses?
4. Were any statistical tests run?
5. Were one- or two-tailed tests run?
6. What were the levels of significance?
7. If a type I error was committed, explain what it would have been.
8. If a type II error was committed, explain what it would have been.
9. What did the studies prove?
10. Two statements are made about significance. One states that StopSmoke provides significant advantages, and the other states that StopSmoke is significantly less expensive than other leading brands. Are they referring to statistical significance? What other type of significance is there?
Expert Solution & Answer
Want to see the full answer?
Check out a sample textbook solution
Students have asked these similar questions
why the answer is 3 and 10?
PS
9 Two films are shown on screen A and screen B at a cinema each evening. The numbers
of people viewing the films on 12 consecutive evenings are shown in the back-to-back
stem-and-leaf diagram.
Screen A (12) Screen B (12)
8
037
34
7 6 4 0 534
74 1645678
92 71689
Key: 116|4 represents 61 viewers for A and 64 viewers for B
A second stem-and-leaf diagram (with rows of the same width as the previous diagram)
is drawn showing the total number of people viewing films at the cinema on each of
these 12 evenings. Find the least and greatest possible number of rows that this second
diagram could have.
TIP
On the evening when 30 people viewed films on screen A, there could have been as few
as 37 or as many as 79 people viewing films on screen B.
Q.2.4 There are twelve (12) teams participating in a pub quiz. What is the probability of correctly predicting the top three teams at the end of the competition, in the correct order? Give your final answer as a fraction in its simplest form.
Chapter 8 Solutions
Elementary Statistics: A Step By Step Approach
Ch. 8.1 - Applying the Concepts 81 Eggs and Your Health The...Ch. 8.1 - Define null and alternative hypotheses, and give...Ch. 8.1 - What is meant by a type I error? A type II error?...Ch. 8.1 - What is meant by a statistical test?Ch. 8.1 - Explain the difference between a one-tailed and a...Ch. 8.1 - What is meant by the critical region? The...Ch. 8.1 - What symbols are used to represent the null...Ch. 8.1 - What symbols are used to represent the...Ch. 8.1 - Explain what is meant by a significant difference.Ch. 8.1 - When should a one-tailed test be used? A...
Ch. 8.1 - In hypothesis testing, why cant the hypothesis be...Ch. 8.1 - Prob. 11ECh. 8.1 - Using the z table (Table E), find the critical...Ch. 8.1 - Prob. 13ECh. 8.1 - For each conjecture, state the null and...Ch. 8.2 - Car Thefts You recently received a job with a...Ch. 8.2 - For Exercises 1 through 25, perform each of the...Ch. 8.2 - Prob. 2ECh. 8.2 - For Exercises 1 through 25, perform each of the...Ch. 8.2 - For Exercises 1 through 25, perform each of the...Ch. 8.2 - Prob. 5ECh. 8.2 - For Exercises 1 through 25, perform each of the...Ch. 8.2 - For Exercises 1 through 25, perform each of the...Ch. 8.2 - For Exercises 1 through 25, perform each of the...Ch. 8.2 - Prob. 9ECh. 8.2 - Prob. 10ECh. 8.2 - Prob. 11ECh. 8.2 - For Exercises 1 through 25, perform each of the...Ch. 8.2 - Prob. 13ECh. 8.2 - For Exercises 1 through 25, perform each of the...Ch. 8.2 - Reject or Not State whether the null hypothesis...Ch. 8.2 - For Exercises 1 through 25, perform each of the...Ch. 8.2 - For Exercises 1 through 25, perform each of the...Ch. 8.2 - For Exercises 1 through 25, perform each of the...Ch. 8.2 - Prob. 19ECh. 8.2 - For Exercises 1 through 25, perform each of the...Ch. 8.2 - For Exercises 1 through 25, perform each of the...Ch. 8.2 - For Exercises 1 through 25, perform each of the...Ch. 8.2 - Transmission Service A car dealer recommends that...Ch. 8.2 - Speeding Tickets A motorist claims that the South...Ch. 8.2 - Sick Days A manager states that in his factory,...Ch. 8.2 - Significance Levels Suppose a statistician chose...Ch. 8.2 - Hourly Wage The president of a company states that...Ch. 8.3 - How Much Nicotine Is in Those Cigarettes? A...Ch. 8.3 - In what ways is the t distribution similar to the...Ch. 8.3 - What are the degrees of freedom for the t test?Ch. 8.3 - Prob. 3ECh. 8.3 - Find the critical value (or values) for the t test...Ch. 8.3 - Using Table F, find the P-value interval for each...Ch. 8.3 - Using Table F, find the P-value interval for each...Ch. 8.3 - Prob. 7ECh. 8.3 - For Exercises 7 through 23, perform each of the...Ch. 8.3 - For Exercises 7 through 23, perform each of the...Ch. 8.3 - For Exercises 7 through 23, perform each of the...Ch. 8.3 - For Exercises 7 through 23, perform each of the...Ch. 8.3 - For Exercises 7 through 23, perform each of the...Ch. 8.3 - Prob. 13ECh. 8.3 - For Exercises 7 through 23, perform each of the...Ch. 8.3 - For Exercises 7 through 23, perform each of the...Ch. 8.3 - For Exercises 7 through 23, perform each of the...Ch. 8.3 - Prob. 17ECh. 8.3 - For Exercises 7 through 23, perform each of the...Ch. 8.3 - For Exercises 7 through 23, perform each of the...Ch. 8.3 - For Exercises 7 through 23, perform each of the...Ch. 8.3 - For Exercises 7 through 23, perform each of the...Ch. 8.3 - For Exercises 7 through 23, perform each of the...Ch. 8.3 - For Exercises 7 through 23, perform each of the...Ch. 8.4 - What were the statistical hypotheses? 2. What were...Ch. 8.4 - Give three examples of proportions.Ch. 8.4 - Why is a proportion considered a binomial...Ch. 8.4 - When you are testing hypotheses by using...Ch. 8.4 - What are the mean and the standard deviation of a...Ch. 8.4 - Prob. 5ECh. 8.4 - For Exercises 5 through 20, perform each of the...Ch. 8.4 - Prob. 7ECh. 8.4 - For Exercises 5 through 20, perform each of the...Ch. 8.4 - Prob. 9ECh. 8.4 - For Exercises 5 through 20, perform each of the...Ch. 8.4 - Prob. 11ECh. 8.4 - For Exercises 5 through 20, perform each of the...Ch. 8.4 - For Exercises 5 through 20, perform each of the...Ch. 8.4 - For Exercises 5 through 20, perform each of the...Ch. 8.4 - Youth Smoking Researchers suspect that 18% of all...Ch. 8.4 - For Exercises 5 through 20, perform each of the...Ch. 8.4 - For Exercises 5 through 20, perform each of the...Ch. 8.4 - For Exercises 5 through 20, perform each of the...Ch. 8.4 - For Exercises 5 through 20, perform each of the...Ch. 8.4 - For Exercises 5 through 20, perform each of the...Ch. 8.4 - When np or nq is not 5 or more, the binomial table...Ch. 8.4 - First-Class Airline Passengers In the past, 20% of...Ch. 8.4 - Show that Z=pppqn can be derived from z=Xu by...Ch. 8.5 - Testing Gas Mileage Claims Assume that you are...Ch. 8.5 - Prob. 1ECh. 8.5 - Using Table G, find the critical value(s) for...Ch. 8.5 - Using Table G, find the P-value interval for each...Ch. 8.5 - Using Table G, find the P-value interval for each...Ch. 8.5 - Prob. 5ECh. 8.5 - For Exercises 5 through 20, assume that the...Ch. 8.5 - For Exercises 5 through 20, assume that the...Ch. 8.5 - For Exercises 5 through 20, assume that the...Ch. 8.5 - Prob. 9ECh. 8.5 - For Exercises 5 through 20, assume that the...Ch. 8.5 - Tornado Deaths A researcher claims that the...Ch. 8.5 - Interstate Speeds It has been reported that the...Ch. 8.5 - Prob. 13ECh. 8.5 - For Exercises 5 through 20, assume that the...Ch. 8.5 - For Exercises 5 through 20, assume that the...Ch. 8.5 - For Exercises 5 through 20, assume that the...Ch. 8.5 - For Exercises 5 through 20, assume that the...Ch. 8.5 - For Exercises 5 through 20, assume that the...Ch. 8.5 - For Exercises 5 through 20, assume that the...Ch. 8.5 - For Exercises 5 through 20, assume that the...Ch. 8.6 - First-Time Births According to the almanac, the...Ch. 8.6 - One-Way Airfares The average one-way airfare from...Ch. 8.6 - Prob. 3ECh. 8.6 - Prison Time According to a public service website,...Ch. 8.6 - Working at Home Workers with a formal arrangement...Ch. 8.6 - Newspaper Reading Times A survey taken several...Ch. 8.6 - Prob. 7ECh. 8.6 - How is the power of a test related to the type II...Ch. 8.6 - Prob. 9ECh. 8 - Prob. 8.2.1RECh. 8 - For Exercises 1 through 20, perform each of the...Ch. 8 - For Exercises 1 through 20, perform each of the...Ch. 8 - For Exercises 1 through 20, perform each of the...Ch. 8 - Prob. 8.2.5RECh. 8 - For Exercises 1 through 20, perform each of the...Ch. 8 - For Exercises 1 through 20, perform each of the...Ch. 8 - For Exercises 1 through 20, perform each of the...Ch. 8 - Prob. 8.4.9RECh. 8 - For Exercises 1 through 20, perform each of the...Ch. 8 - For Exercises 1 through 20, perform each of the...Ch. 8 - Prob. 8.4.12RECh. 8 - For Exercises 1 through 20, perform each of the...Ch. 8 - For Exercises 1 through 20, perform each of the...Ch. 8 - For Exercises 5 through 20, assume that the...Ch. 8 - For Exercises 5 through 20, assume that the...Ch. 8 - For Exercises 5 through 20, assume that the...Ch. 8 - Prob. 8.5.18RECh. 8 - Plant Leaf Lengths A biologist knows that the...Ch. 8 - Tire Inflation To see whether people are keeping...Ch. 8 - The Data Bank is found in Appendix B, or on the...Ch. 8 - Select a random sample of 15 individuals and test...Ch. 8 - Select a random sample of at least 30 individuals,...Ch. 8 - Select a sample of 20 individuals and test the...Ch. 8 - Using the data from Data Set XIII, select a sample...Ch. 8 - Using the data obtained in Exercise 5, test the...Ch. 8 - Determine whether each statement is true or false....Ch. 8 - Determine whether each statement is true or false....Ch. 8 - Determine whether each statement is true or false....Ch. 8 - Determine whether each statement is true or false....Ch. 8 - Determine whether each statement is true or false....Ch. 8 - When the value of is increased, the probability...Ch. 8 - If you wish to test the claim that the mean of the...Ch. 8 - The degrees of freedom for the chi-square test for...Ch. 8 - For the t test, one uses _______ instead of . a. n...Ch. 8 - Complete the following statements with the best...Ch. 8 - Complete the following statements with the best...Ch. 8 - A conjecture about a population parameter is...Ch. 8 - Complete the following statements with the best...Ch. 8 - Complete the following statements with the best...Ch. 8 - For the following exercises where applicable: a....Ch. 8 - For Exercises 1 through 25, perform each of the...Ch. 8 - For Exercises 1 through 25, perform each of the...Ch. 8 - Prob. 18CQCh. 8 - Prob. 19CQCh. 8 - For Exercises 1 through 25, perform each of the...Ch. 8 - Prob. 21CQCh. 8 - Prob. 22CQCh. 8 - For the following exercises where applicable: a....Ch. 8 - For the following exercises where applicable: a....Ch. 8 - For the following exercises where applicable: a....Ch. 8 - Prob. 26CQCh. 8 - Prob. 27CQCh. 8 - Find the P-value for the z test in Exercise 16....Ch. 8 - Prob. 29CQCh. 8 - Prob. 30CQCh. 8 - For the following exercises where applicable: a....Ch. 8 - Strength of Wrapping Cord A manufacturer claims...Ch. 8 - Prob. 33CQCh. 8 - Find the 95% confidence interval for the mean in...Ch. 8 - Critical Thinking Challenges The power of a test...
Knowledge Booster


Learn more about
Need a deep-dive on the concept behind this application? Look no further. Learn more about this topic, statistics and related others by exploring similar questions and additional content below.Similar questions
- The table below indicates the number of years of experience of a sample of employees who work on a particular production line and the corresponding number of units of a good that each employee produced last month. Years of Experience (x) Number of Goods (y) 11 63 5 57 1 48 4 54 5 45 3 51 Q.1.1 By completing the table below and then applying the relevant formulae, determine the line of best fit for this bivariate data set. Do NOT change the units for the variables. X y X2 xy Ex= Ey= EX2 EXY= Q.1.2 Estimate the number of units of the good that would have been produced last month by an employee with 8 years of experience. Q.1.3 Using your calculator, determine the coefficient of correlation for the data set. Interpret your answer. Q.1.4 Compute the coefficient of determination for the data set. Interpret your answer.arrow_forwardCan you answer this question for mearrow_forwardTechniques QUAT6221 2025 PT B... TM Tabudi Maphoru Activities Assessments Class Progress lIE Library • Help v The table below shows the prices (R) and quantities (kg) of rice, meat and potatoes items bought during 2013 and 2014: 2013 2014 P1Qo PoQo Q1Po P1Q1 Price Ро Quantity Qo Price P1 Quantity Q1 Rice 7 80 6 70 480 560 490 420 Meat 30 50 35 60 1 750 1 500 1 800 2 100 Potatoes 3 100 3 100 300 300 300 300 TOTAL 40 230 44 230 2 530 2 360 2 590 2 820 Instructions: 1 Corall dawn to tha bottom of thir ceraan urina se se tha haca nariad in archerca antarand cubmit Q Search ENG US 口X 2025/05arrow_forward
- The table below indicates the number of years of experience of a sample of employees who work on a particular production line and the corresponding number of units of a good that each employee produced last month. Years of Experience (x) Number of Goods (y) 11 63 5 57 1 48 4 54 45 3 51 Q.1.1 By completing the table below and then applying the relevant formulae, determine the line of best fit for this bivariate data set. Do NOT change the units for the variables. X y X2 xy Ex= Ey= EX2 EXY= Q.1.2 Estimate the number of units of the good that would have been produced last month by an employee with 8 years of experience. Q.1.3 Using your calculator, determine the coefficient of correlation for the data set. Interpret your answer. Q.1.4 Compute the coefficient of determination for the data set. Interpret your answer.arrow_forwardQ.3.2 A sample of consumers was asked to name their favourite fruit. The results regarding the popularity of the different fruits are given in the following table. Type of Fruit Number of Consumers Banana 25 Apple 20 Orange 5 TOTAL 50 Draw a bar chart to graphically illustrate the results given in the table.arrow_forwardQ.2.3 The probability that a randomly selected employee of Company Z is female is 0.75. The probability that an employee of the same company works in the Production department, given that the employee is female, is 0.25. What is the probability that a randomly selected employee of the company will be female and will work in the Production department? Q.2.4 There are twelve (12) teams participating in a pub quiz. What is the probability of correctly predicting the top three teams at the end of the competition, in the correct order? Give your final answer as a fraction in its simplest form.arrow_forward
- Q.2.1 A bag contains 13 red and 9 green marbles. You are asked to select two (2) marbles from the bag. The first marble selected will not be placed back into the bag. Q.2.1.1 Construct a probability tree to indicate the various possible outcomes and their probabilities (as fractions). Q.2.1.2 What is the probability that the two selected marbles will be the same colour? Q.2.2 The following contingency table gives the results of a sample survey of South African male and female respondents with regard to their preferred brand of sports watch: PREFERRED BRAND OF SPORTS WATCH Samsung Apple Garmin TOTAL No. of Females 30 100 40 170 No. of Males 75 125 80 280 TOTAL 105 225 120 450 Q.2.2.1 What is the probability of randomly selecting a respondent from the sample who prefers Garmin? Q.2.2.2 What is the probability of randomly selecting a respondent from the sample who is not female? Q.2.2.3 What is the probability of randomly…arrow_forwardTest the claim that a student's pulse rate is different when taking a quiz than attending a regular class. The mean pulse rate difference is 2.7 with 10 students. Use a significance level of 0.005. Pulse rate difference(Quiz - Lecture) 2 -1 5 -8 1 20 15 -4 9 -12arrow_forwardThe following ordered data list shows the data speeds for cell phones used by a telephone company at an airport: A. Calculate the Measures of Central Tendency from the ungrouped data list. B. Group the data in an appropriate frequency table. C. Calculate the Measures of Central Tendency using the table in point B. D. Are there differences in the measurements obtained in A and C? Why (give at least one justified reason)? I leave the answers to A and B to resolve the remaining two. 0.8 1.4 1.8 1.9 3.2 3.6 4.5 4.5 4.6 6.2 6.5 7.7 7.9 9.9 10.2 10.3 10.9 11.1 11.1 11.6 11.8 12.0 13.1 13.5 13.7 14.1 14.2 14.7 15.0 15.1 15.5 15.8 16.0 17.5 18.2 20.2 21.1 21.5 22.2 22.4 23.1 24.5 25.7 28.5 34.6 38.5 43.0 55.6 71.3 77.8 A. Measures of Central Tendency We are to calculate: Mean, Median, Mode The data (already ordered) is: 0.8, 1.4, 1.8, 1.9, 3.2, 3.6, 4.5, 4.5, 4.6, 6.2, 6.5, 7.7, 7.9, 9.9, 10.2, 10.3, 10.9, 11.1, 11.1, 11.6, 11.8, 12.0, 13.1, 13.5, 13.7, 14.1, 14.2, 14.7, 15.0, 15.1, 15.5,…arrow_forward
- PEER REPLY 1: Choose a classmate's Main Post. 1. Indicate a range of values for the independent variable (x) that is reasonable based on the data provided. 2. Explain what the predicted range of dependent values should be based on the range of independent values.arrow_forwardIn a company with 80 employees, 60 earn $10.00 per hour and 20 earn $13.00 per hour. Is this average hourly wage considered representative?arrow_forwardThe following is a list of questions answered correctly on an exam. Calculate the Measures of Central Tendency from the ungrouped data list. NUMBER OF QUESTIONS ANSWERED CORRECTLY ON AN APTITUDE EXAM 112 72 69 97 107 73 92 76 86 73 126 128 118 127 124 82 104 132 134 83 92 108 96 100 92 115 76 91 102 81 95 141 81 80 106 84 119 113 98 75 68 98 115 106 95 100 85 94 106 119arrow_forward
arrow_back_ios
SEE MORE QUESTIONS
arrow_forward_ios
Recommended textbooks for you
 College Algebra (MindTap Course List)AlgebraISBN:9781305652231Author:R. David Gustafson, Jeff HughesPublisher:Cengage Learning
 Glencoe Algebra 1, Student Edition, 9780079039897...AlgebraISBN:9780079039897Author:CarterPublisher:McGraw Hill
College Algebra (MindTap Course List)
Algebra
ISBN:9781305652231
Author:R. David Gustafson, Jeff Hughes
Publisher:Cengage Learning
Glencoe Algebra 1, Student Edition, 9780079039897...
Algebra
ISBN:9780079039897
Author:Carter
Publisher:McGraw Hill
Type I and II Errors, Power, Effect Size, Significance and Power Analysis in Quantitative Research; Author: NurseKillam;https://www.youtube.com/watch?v=OWn3Ko1WYTA;License: Standard YouTube License, CC-BY