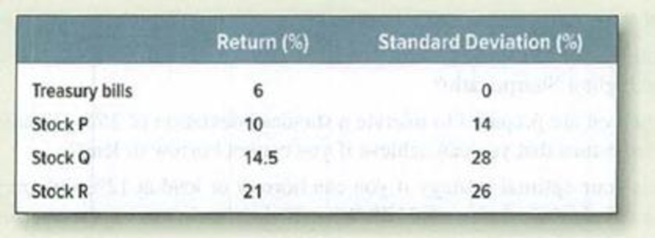
Portfolio risk and return* Here are returns and standard deviations for four investments.

Calculate the standard deviations of (the following portfolios.
- a. 50% in Treasury bills, 50% in stock P.
- b. 50% each in Q and R, assuming the shares have
- • Perfect positive correlation.
- • Perfect negative correlation.
- • No correlation.
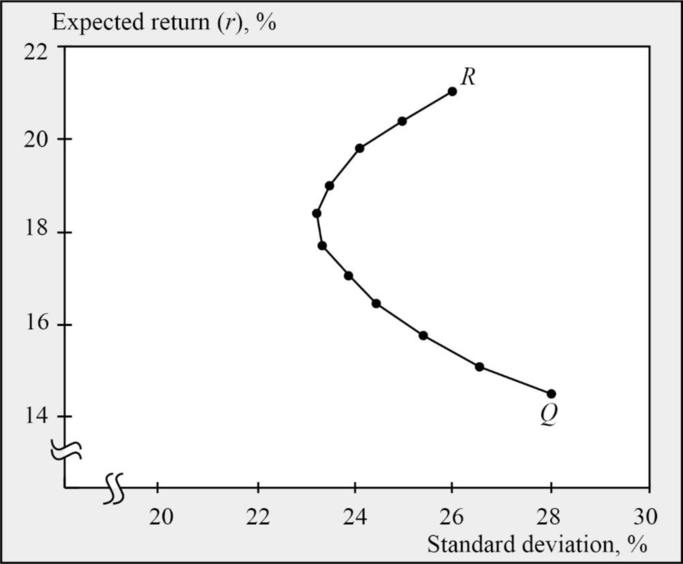
- c. Plot a figure like Figure 8.3 for Q and R, assuming a correlation coefficient of .5.
- d. Stock Q has a lower return than R but a higher standard deviation. Does that mean that Q’s price is too high or that R’s price is too low?
a)
To determine: Standard deviation of 50% Treasury bills and 50% in stock P.
Explanation of Solution
Given information:

Calculation of standard deviation:
Therefore, the standard deviation is 7%
b)
To determine: Standard deviation of 50% each in Q and R in the following situations.
Explanation of Solution
With a perfect positive correlation:
Therefore, the standard deviation in a perfect positive correlation is 27%
With a perfect negative correlation:
Therefore, the standard deviation in a perfect positive correlation is 1%
With no correlation:
Therefore, the standard deviation in a perfect positive correlation is 19.1%
c)
To graph: Figure showing the stocks of Q and R by assuming a correlation coefficient of 0.5
Explanation of Solution

d)
To discuss: If Q has a low return than R but with a higher standard deviation whether this mean that price of Q’s stock is too high or price of R’s stock is too low.
Explanation of Solution
When stock Q has lower return that stock R but, higher standard deviation, thus this doesn’t mean that price of Q’s stock is too high or price of R’s stock is too low. Because the risk factor is measured by beta not by the standard deviation.
Standard deviation measures the total risk whereas, beta measures non-diversifiable risk and inventors are solely compensated with a risk premium in holding the non-diversifiable risk.
Want to see more full solutions like this?
Chapter 8 Solutions
Principles of Corporate Finance (Mcgraw-hill/Irwin Series in Finance, Insurance, and Real Estate)
- High Hand Nursery has total assests of $900,000, current liabilities of $202,000, and long-term liabilities of $104,000. There is $90,000 in preferred stock outstanding. Twenty thousand shares of common stock have been issued. a. Compute book value (net worth) per share. b. If there is $40,000 in earnings available to common stockholders for dividends, and the firm's stock has a P/E of 22 times earnings per share, what is the current price of the stock? c. What is the ratio of market value per share to book value per share?arrow_forwardNeed the WACC % WACC and Optimal Capital Structure F. Pierce Products Inc. is considering changing its capital structure. F. Pierce currently has no debt and no preferred stock, but it would like to add some debt to take advantage of the tax shield. Its investment banker has indicated that the pre-tax cost of debt under various possible capital structures would be as follows: Market Debt-to-Value Ratio (wd) Market Equity-to-Value Ratio (ws) Market Debt-toEquity Ratio (D/S) Before-Tax Cost ofDebt (rd) 0.0 1.0 0.00 6.0 % 0.10 0.90 0.1111 6.4 0.20 0.80 0.2500 7.0 0.30 0.70 0.4286 8.2 0.40 0.60 0.6667 10.0 F. Pierce uses the CAPM to estimate its cost of common equity, rs, and at the time of the analaysis the risk-free rate is 5%, the market risk premium is 7%, and the company's tax rate is 25%. F. Pierce estimates that its beta now (which is "unlevered" because it currently has no debt) is 1.4. Based on this information, what…arrow_forwardNed's Co. has an average collection period of 45 days and an operating cycle of 130 days. It has a policy of keeping at least $10 on hand as a minimum cash balance, and has a beginning cash balance for the first quarter of $20. Beginning receivables for the quarter amount to $35. Sales for the first and second quarters are expected to be $110 and $125, respectively, while purchases amount to 80% of the next quarter's forecast sales. The accounts payable period is 90 days. What are the cash disbursements for the first quarter? Question 4 options: $92 $88 $76 $100 $110arrow_forward
- Liberal credit terms for customers is associated with a restrictive short-term financial policy. Question 3 options: True Falsearrow_forwardAn accounts payable period decrease would increase the length of a firm's cash cycle. Consider each in isolation. Question 6 options: True Falsearrow_forwardWhich of the following is the best definition of cash budget? Question 10 options: Costs that rise with increases in the level of investment in current assets. A forecast of cash receipts and disbursements for the next planning period. A secured short-term loan that involves either the assignment or factoring of the receivable. The time between sale of inventory and collection of the receivable. The time between receipt of inventory and payment for it.arrow_forward
- Short-term financial decisions are typically defined to include cash inflows and outflows that occur within __ year(s) or less. Question 9 options: Four Two Three Five Onearrow_forwardA national firm has sales of $575,000 and cost of goods sold of $368,000. At the beginning of the year, the inventory was $42,000. At the end of the year, the inventory balance was $45,000. What is the inventory turnover rate? Question 8 options: 8.46 times 13.22 times 43.14 times 12.78 times 28.56 timesarrow_forwardThe formula (Cash cycle + accounts payable period) correctly defines the operating cycle. Question 7 options: False Truearrow_forward
- An accounts payable period decrease would increase the length of a firm's cash cycle. Consider each in isolation. Question 6 options: True Falsearrow_forwardWhich of the following issues is/are NOT considered a part of short-term finance? Question 5 options: The amount of credit that should be extended to customers The firm determining whether to issue commercial paper or obtain a bank loan The amount of the firms current income that should be paid out as dividends The amount the firm should borrow short-term A reasonable level of cash for the firm to maintainarrow_forwardLiberal credit terms for customers is associated with a restrictive short-term financial policy. Question 3 options: True Falsearrow_forward
 EBK CONTEMPORARY FINANCIAL MANAGEMENTFinanceISBN:9781337514835Author:MOYERPublisher:CENGAGE LEARNING - CONSIGNMENT
