
Concept explainers
Videos
Credit card spending An analysis of spending by a sample of credit card bank cardholders shows that spending by cardholders in January (Jan) is related to their spending in December (Dec):
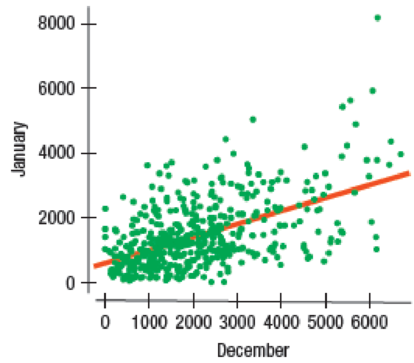
The assumptions and conditions of the linear regression seemed to be satisfied and an analyst was about to predict January spending using the model
Another analyst worried that different types of cardholders might behave differently. She examined the spending patterns of the cardholders and placed them into five market Segments. When she plotted the data using different colors and symbols for the five different segments, she found the following:
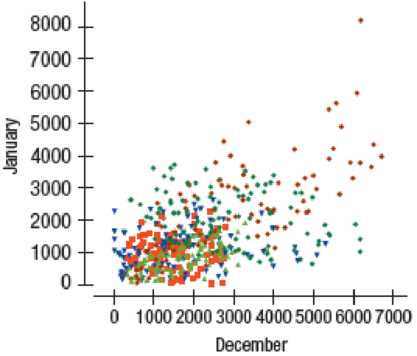
Look at this plot carefully and discuss why she might be worried about the predictions from the model
Being worried to make a prediction from the model
Explanation of Solution
Given info:
A scatterplot of spending for a sample of credit card bank cardholders in January and in December is given. The corresponding regression model to predict January spending from December spending is
Another scatterplot of spending for a sample of credit card bank cardholders in January and that in December for five market segments is given.
Justification:
The conditions for a scatterplot that is well-fitted for the data is as follows:
- Straight enough condition: The relationship between y and x is straight enough to proceed with a linear regression model.
- Outlier condition: No outlier must be there which influences the fit of the least square line.
- Thickness condition: The spread of the data around the generally straight relationship seems to be consistent for all values of x.
The different segments are not scattered at random throughout the scatterplot.
Thus, the spread of the data is not consistent for all values of December and each segment may have a different relationship that might affect the accuracy of the model to predict.
The relationship between the spending of credit card bank cardholders in January and in December is not straight enough to proceed with a linear regression model.
Want to see more full solutions like this?
Chapter 8 Solutions
Intro Stats


- 18 Using the results from the rainfall versus corn production data in Question 14, answer DOV 15 the following: a. Find and interpret the slope in the con- text of this problem. 79 b. Find the Y-intercept in the context of this problem. alb to sig c. Can the Y-intercept be interpreted here? (.ob or grinisiques xs as 101 gniwollol edt 958 orb sz) asiques sich ed: flow wo PEMAIarrow_forwardVariable Total score (Y) Putts hit (X) Mean. 93.900 35.780 Standard Deviation 7.717 4.554 Correlation 0.896arrow_forward17 Referring to the figures and tables from the golf data in Questions 3 and 13, what hap- pens as you keep increasing X? Does Y increase forever? Explain. comis word ே om zol 6 svari woy wol visy alto su and vibed si s'ablow it bas akiog vino b tad) beil Bopara Aon csu How wod griz -do 30 義arrow_forward
- Variable Temperature (X) Coffees sold (Y) Mean 35.08 29,913 Standard Deviation 16.29 12,174 Correlation -0.741arrow_forward13 A golf analyst measures the total score and number of putts hit for 100 rounds of golf an amateur plays; you can see the summary of statistics in the following table. (See the figure in Question 3 for a scatterplot of this data.)noitoloqpics bella a. Is it reasonable to use a line to fit this data? Explain. 101 250 b. Find the equation of the best fitting 15er regression line. ad aufstuess som 'moob Y lo esulav in X ni ognado a tad Variable on Mean Standard Correlation 92 Deviation Total score (Y) 93.900 7.717 0.896 Putts hit (X) 35.780 4.554 totenololbenq axlam riso voy X to asulisy datdw gribol anil er 08,080.0 zl noitsism.A How atharrow_forwardVariable Bone loss (Y) Age (X) Mean 35.008. 67.992 Standard Deviation 7.684 10.673 Correlation 0.574arrow_forward
- 50 Bone Loss 30 40 20 Scatterplot of Bone Loss vs. Age . [902) 10 50 60 70 80 90 Age a sub adi u xinq (20) E 4 adw I- nyd med ivia .0 What does a scatterplot that shows no linear relationship between X and Y look like?arrow_forwardVariable Temperature (X) Coffees sold (Y) Mean 35.08 29,913 Standard Deviation 16.29 12,174 Correlation -0.741arrow_forward2 Find and interpret the value of r² for the rainfall versus corn data, using the table from Question 14.2291992 b sgen gnome vixists 992 ms up? 2910 1999 bio .blos estos $22 tolqis2 qs rieds ni zoti swoH iisqa vilsen od 1'meo DOV to mogers boangas mus jil Reustar enou Leption20th ) abnuin Hagodt graub 032 Carrow_forward
- 18 Using the results from the rainfall versus corn production data in Question 14, answer oy the following: DOY 98 103 LA Find and interpret the slope in the con- text of this problem. b. Find the Y-intercept in the context of this problem. roy gatiigisve Toy c. Can the Y-intercept be interpreted here? (.ob o grinisq blo eiqmaxs as 101 galwollol edt 998 ds most notamotni er griau sib 952) siqmaxs steb godt llaw worl pun MAarrow_forwardVariable mean standard variation correlation temperature(X) 35.08 16.29. -0,741 coffees sold(Y). 29,913. 12.174.arrow_forward12 ம் Y si to no 1672 1 A medical researcher measures bone density and the age of 125 women; you can see the o lesummary of statistics in the following table. (See the figure in Question 2 for a scatterplot of this data.) a. How well will a line fit this data? b. Find the equation of the best fitting regression line. Variable Mean Standard Correlation Deviation Bone loss (Y) 35.008 7.684 0.574 A Age (X) 19 67.992 10.673 T in send art lo (d) sqala sala bolt 3 esmit sqola ad garrow_forward
 Big Ideas Math A Bridge To Success Algebra 1: Stu...AlgebraISBN:9781680331141Author:HOUGHTON MIFFLIN HARCOURTPublisher:Houghton Mifflin Harcourt
 Glencoe Algebra 1, Student Edition, 9780079039897...AlgebraISBN:9780079039897Author:CarterPublisher:McGraw Hill
 College AlgebraAlgebraISBN:9781305115545Author:James Stewart, Lothar Redlin, Saleem WatsonPublisher:Cengage Learning
 Functions and Change: A Modeling Approach to Coll...AlgebraISBN:9781337111348Author:Bruce Crauder, Benny Evans, Alan NoellPublisher:Cengage Learning
 Algebra and Trigonometry (MindTap Course List)AlgebraISBN:9781305071742Author:James Stewart, Lothar Redlin, Saleem WatsonPublisher:Cengage Learning