
Concept explainers
Videos
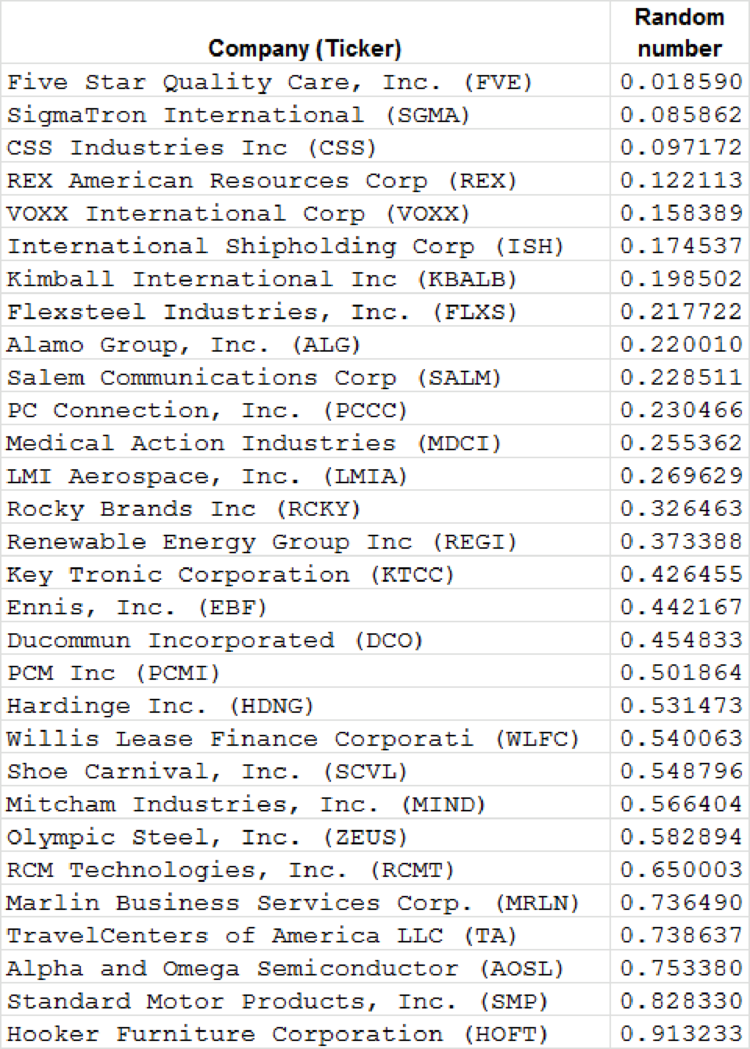
Shadow Stocks. Jack Lawler, a financial analyst, wants to prepare an article on the Shadow Stock portfolio developed by the American Association of Individual Investors (AAII). A list of the 30 companies in the Shadow Stock portfolio is contained in the file ShadowStocks. Jack would like to select a simple random sample of 5 of these companies for an interview concerning management practices.
- a. In the file ShadowStock, companies are listed in column A of an Excel worksheet. In column B we have generated a random number for each of the companies. Use these random numbers to select a simple random sample of 5 of these companies for Jack.
- b. Generate a new set of random numbers and use them to select a new simple random sample. Did you select the same companies?
a.
Select a simple random sample of 5 of the given companies using the given random numbers.
Answer to Problem 42SE
The random sample of 5 of the given companies is tabulated below:
| Company |
Random Number |
| LMI Aerospace | 0.008012 |
| Alpha & Omega Semiconductor | 0.055369 |
| Olympic Steel | 0.059279 |
| Kimball International | 0.144127 |
| International Shipholding | 0.227759 |
Explanation of Solution
Calculation:
The given data represent the Shadow Stock of 30 companies.
Step-by-step procedure to obtain a simple random sample.
- Open the data file Shadow Stocks.
- Sort the random numbers and the corresponding company names into an ascending order.
- Select the companies associated with the first five smallest random numbers.
Thus, the random sample of 5 of the given companies is tabulated below:
| Company |
Random Number |
| LMI Aerospace | 0.008012 |
| Alpha & Omega Semiconductor | 0.055369 |
| Olympic Steel | 0.059279 |
| Kimball International | 0.144127 |
| International Shipholding | 0.227759 |
b.
Generate a new random set of random numbers and select a new simple random sample.
Check whether the companies in the new simple random sample are the same as in Part (a).
Answer to Problem 42SE
The new simple random sample of the given companies is as follows:
| Company |
Random Number |
| Five Star Quality Care | 0.018590 |
| SigmaTron International | 0.085862 |
| CSS Industries | 0.097172 |
| REX American Resources Corp | 0.122113 |
| VOXX International Corp | 0.158389 |
The companies in the new random samples do not match with the companies in the random sample of Part (a).
Explanation of Solution
Calculation:
A new simple random sample is to be obtained.
Software procedure:
Step-by-step software procedure to obtain a random sample using EXCEL.
- Open the EXCEL.
- Enter company names in column A.
- Generate a new set of random numbers using the formula “=RAND()” in column B.
- Sort the random numbers and the corresponding company names into an ascending order.
- Select the companies associated with the first five smallest random numbers.
The output obtained using EXCEL software is as follows:
Therefore, the random sample of 5 of the given companies is as follows:
| Company |
Random Number |
| Five Star Quality Care | 0.018590 |
| SigmaTron International | 0.085862 |
| CSS Industries | 0.097172 |
| REX American Resources Corp | 0.122113 |
| VOXX International Corp | 0.158389 |
Here, it is observed that the companies in the new random sample do not match with the companies in the random sample of Part (a).
Want to see more full solutions like this?
Chapter 7 Solutions
Essentials of Statistics for Business and Economics (with XLSTAT Printed Access Card)


- Consider the state space model X₁ = §Xt−1 + Wt, Yt = AX+Vt, where Xt Є R4 and Y E R². Suppose we know the covariance matrices for Wt and Vt. How many unknown parameters are there in the model?arrow_forwardBusiness Discussarrow_forwardYou want to obtain a sample to estimate the proportion of a population that possess a particular genetic marker. Based on previous evidence, you believe approximately p∗=11% of the population have the genetic marker. You would like to be 90% confident that your estimate is within 0.5% of the true population proportion. How large of a sample size is required?n = (Wrong: 10,603) Do not round mid-calculation. However, you may use a critical value accurate to three decimal places.arrow_forward
- 2. [20] Let {X1,..., Xn} be a random sample from Ber(p), where p = (0, 1). Consider two estimators of the parameter p: 1 p=X_and_p= n+2 (x+1). For each of p and p, find the bias and MSE.arrow_forward1. [20] The joint PDF of RVs X and Y is given by xe-(z+y), r>0, y > 0, fx,y(x, y) = 0, otherwise. (a) Find P(0X≤1, 1arrow_forward4. [20] Let {X1,..., X} be a random sample from a continuous distribution with PDF f(x; 0) = { Axe 5 0, x > 0, otherwise. where > 0 is an unknown parameter. Let {x1,...,xn} be an observed sample. (a) Find the value of c in the PDF. (b) Find the likelihood function of 0. (c) Find the MLE, Ô, of 0. (d) Find the bias and MSE of 0.arrow_forward3. [20] Let {X1,..., Xn} be a random sample from a binomial distribution Bin(30, p), where p (0, 1) is unknown. Let {x1,...,xn} be an observed sample. (a) Find the likelihood function of p. (b) Find the MLE, p, of p. (c) Find the bias and MSE of p.arrow_forwardGiven the sample space: ΩΞ = {a,b,c,d,e,f} and events: {a,b,e,f} A = {a, b, c, d}, B = {c, d, e, f}, and C = {a, b, e, f} For parts a-c: determine the outcomes in each of the provided sets. Use proper set notation. a. (ACB) C (AN (BUC) C) U (AN (BUC)) AC UBC UCC b. C. d. If the outcomes in 2 are equally likely, calculate P(AN BNC).arrow_forwardSuppose a sample of O-rings was obtained and the wall thickness (in inches) of each was recorded. Use a normal probability plot to assess whether the sample data could have come from a population that is normally distributed. Click here to view the table of critical values for normal probability plots. Click here to view page 1 of the standard normal distribution table. Click here to view page 2 of the standard normal distribution table. 0.191 0.186 0.201 0.2005 0.203 0.210 0.234 0.248 0.260 0.273 0.281 0.290 0.305 0.310 0.308 0.311 Using the correlation coefficient of the normal probability plot, is it reasonable to conclude that the population is normally distributed? Select the correct choice below and fill in the answer boxes within your choice. (Round to three decimal places as needed.) ○ A. Yes. The correlation between the expected z-scores and the observed data, , exceeds the critical value, . Therefore, it is reasonable to conclude that the data come from a normal population. ○…arrow_forwardding question ypothesis at a=0.01 and at a = 37. Consider the following hypotheses: 20 Ho: μ=12 HA: μ12 Find the p-value for this hypothesis test based on the following sample information. a. x=11; s= 3.2; n = 36 b. x = 13; s=3.2; n = 36 C. c. d. x = 11; s= 2.8; n=36 x = 11; s= 2.8; n = 49arrow_forward13. A pharmaceutical company has developed a new drug for depression. There is a concern, however, that the drug also raises the blood pressure of its users. A researcher wants to conduct a test to validate this claim. Would the manager of the pharmaceutical company be more concerned about a Type I error or a Type II error? Explain.arrow_forwardFind the z score that corresponds to the given area 30% below z.arrow_forwardarrow_back_iosSEE MORE QUESTIONSarrow_forward_ios
 Holt Mcdougal Larson Pre-algebra: Student Edition...AlgebraISBN:9780547587776Author:HOLT MCDOUGALPublisher:HOLT MCDOUGAL
 Glencoe Algebra 1, Student Edition, 9780079039897...AlgebraISBN:9780079039897Author:CarterPublisher:McGraw Hill
 College Algebra (MindTap Course List)AlgebraISBN:9781305652231Author:R. David Gustafson, Jeff HughesPublisher:Cengage Learning
 Big Ideas Math A Bridge To Success Algebra 1: Stu...AlgebraISBN:9781680331141Author:HOUGHTON MIFFLIN HARCOURTPublisher:Houghton Mifflin Harcourt