
Concept explainers
Videos
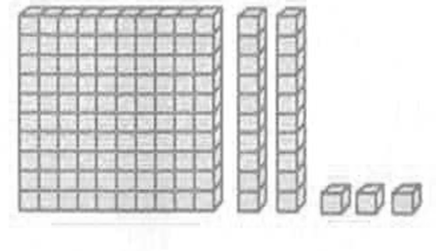
In a set of base-ten blocks, let 1 flat represents 1 unit.
a. What does 1 long represents?
b. What does 1 cube represents?
c. Represent 1.23 using the blocks with these representations.
(a)
To find:
In a set of base-ten block, 1 long represents.
Answer to Problem 1NT
Solution:
1 long represents
Explanation of Solution
Given:
In a set of base-ten blocks, 1 flat represents 1 unit.
Approach:
Write decimal in form of tenths and hundredths.
Calculation:
There are 10 block/ long in 1 flat.
Hence, 1 long/ block represents 0.1 flat.
(b)
To find:
In a set of base-ten block, 1 cube represents.
Answer to Problem 1NT
Solution:
1 cube represents
Explanation of Solution
Given:
In a set of base-ten blocks, 1 flat represents 1 unit.
Approach:
Write decimal in form of tenths and hundredths.
Calculation:
There are again 10 cubes in 1 long.
By equation (1)
Hence, 1 cube represents 0.01 flat.
(c)
To represent:
The number 1.23 using blocks.
Answer to Problem 1NT
Solution:
The representation of 1.23 is
Explanation of Solution
Given:
In a set of base-ten blocks, 1 flat represents 1 unit.
Approach:
Write decimal in form of tenths and hundredths.
Calculation:
Here
1 long = 0.1 flat
1 cube = 0.01 flat
Here 1 represent 1 flat,
Want to see more full solutions like this?
Chapter 7 Solutions
A Problem Solving Approach To Mathematics For Elementary School Teachers (13th Edition)


- Given the following system of equations and its graph below, what can be determined about the slopes and y-intercepts of the system of equations? 7 y 6 5 4 3 2 -6-5-4-3-2-1 1+ -2 1 2 3 4 5 6 x + 2y = 8 2x + 4y = 12 The slopes are different, and the y-intercepts are different. The slopes are different, and the y-intercepts are the same. The slopes are the same, and the y-intercepts are different. O The slopes are the same, and the y-intercepts are the same.arrow_forwardChoose the function to match the graph. -2- 0 -7 -8 -9 --10- |--11- -12- f(x) = log x + 5 f(x) = log x - 5 f(x) = log (x+5) f(x) = log (x-5) 9 10 11 12 13 14arrow_forwardQ2 H let x(+) = &cos (Ait+U) and. 4(+) = ß cos(12t +V), where d. B. 1. In Constants and U,V indep.rus have uniform dist. (-π,π) Show that: ①Rxy (+,4+1)=0 @ Rxy (++) = cos [ when U=V Q3 let x(t) is stochastic process with Wss -121 e, and Rx ltst+1) = ( 2, show that E(X) = E(XS-X₁)² = 2(-1). Qu let x(t) = U Cost + (V+1) Sint, tεIR. where UV indep.rus, and let E (U)-E(V)=0 and E(U) = E(V) = 1, show that Cov (Xt, Xs) = K (t,s) = cos(s-t) X(+) is not WSS.arrow_forward
- Which of the following represents the graph of f(x)=3x-2? 7 6 5 4 ++ + + -7-6-5-4-3-2-1 1 2 3 4 5 6 7 -2 3 -5 6 -7 96 7 5 4 O++ -7-6-5-4-3-2-1 -2 -3 -4 -5 -7 765 432 -7-6-5-4-3-2-1 -2 ++ -3 -4 -5 -6 2 3 4 5 6 7 7 6 2 345 67 -7-6-5-4-3-2-1 2 3 4 5 67 4 -5arrow_forward21. find the mean. and variance of the following: Ⓒ x(t) = Ut +V, and V indepriv. s.t U.VN NL0, 63). X(t) = t² + Ut +V, U and V incepires have N (0,8) Ut ①xt = e UNN (0162) ~ X+ = UCOSTE, UNNL0, 62) SU, Oct ⑤Xt= 7 where U. Vindp.rus +> ½ have NL, 62). ⑥Xn = ΣY, 41, 42, 43, ... Yn vandom sample K=1 Text with mean zen and variance 6arrow_forwardA psychology researcher conducted a Chi-Square Test of Independence to examine whether there is a relationship between college students’ year in school (Freshman, Sophomore, Junior, Senior) and their preferred coping strategy for academic stress (Problem-Focused, Emotion-Focused, Avoidance). The test yielded the following result: image.png Interpret the results of this analysis. In your response, clearly explain: Whether the result is statistically significant and why. What this means about the relationship between year in school and coping strategy. What the researcher should conclude based on these findings.arrow_forward
- A 20 foot ladder rests on level ground; its head (top) is against a vertical wall. The bottom of the ladder begins by being 12 feet from the wall but begins moving away at the rate of 0.1 feet per second. At what rate is the top of the ladder slipping down the wall? You may use a calculator.arrow_forwardA school counselor is conducting a research study to examine whether there is a relationship between the number of times teenagers report vaping per week and their academic performance, measured by GPA. The counselor collects data from a sample of high school students. Write the null and alternative hypotheses for this study. Clearly state your hypotheses in terms of the correlation between vaping frequency and academic performance. EditViewInsertFormatToolsTable 12pt Paragrapharrow_forwardPlease help solve the following whilst showing all working out. Is part of exam revision questions but no solution is givenarrow_forward
 Algebra & Trigonometry with Analytic GeometryAlgebraISBN:9781133382119Author:SwokowskiPublisher:Cengage
 Holt Mcdougal Larson Pre-algebra: Student Edition...AlgebraISBN:9780547587776Author:HOLT MCDOUGALPublisher:HOLT MCDOUGAL
 Glencoe Algebra 1, Student Edition, 9780079039897...AlgebraISBN:9780079039897Author:CarterPublisher:McGraw Hill
 Algebra: Structure And Method, Book 1AlgebraISBN:9780395977224Author:Richard G. Brown, Mary P. Dolciani, Robert H. Sorgenfrey, William L. ColePublisher:McDougal Littell
 Mathematics For Machine TechnologyAdvanced MathISBN:9781337798310Author:Peterson, John.Publisher:Cengage Learning,
 College Algebra (MindTap Course List)AlgebraISBN:9781305652231Author:R. David Gustafson, Jeff HughesPublisher:Cengage Learning