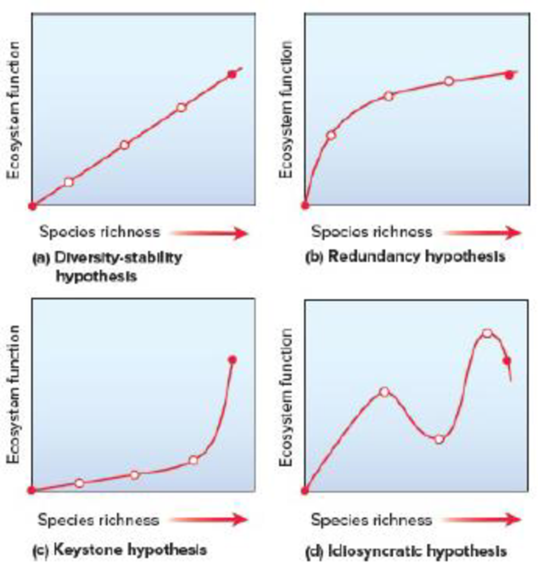
Core Skill: Modeling The goal of this modeling challenge is to draw a graph showing a different relationship between ecosystem function and species richness, one based on the rivet hypothesis, which was proposed in 1981.
Modeling Challenge: In 1981, Paul and Ann Ehrlich proposed a relationship between ecosystem function and species richness called the rivet hypothesis. In this model, species are like the rivets on an airplane. Some species play a small but critical role in keeping the plane, the ecosystem, airborne, while other species do not, and we cannot tell beforehand which species affect the ecosystem function the most. The loss of a single rivet will probably not weaken the plane. However, the loss of few rivets would impair airworthiness. The plane could still function but not at maximum efficiency. Continuing on, the loss of a few more rivets could again be tolerated, but the loss of yet more rivets would prove critical to the airplane’s function. Thus, ecosystem function declines with decreased species richness in a stepwise fashion. Draw a graph that depicts a model for the rivet hypothesis. Use the same format as those in Figure 60.2.

Figure 60.2 Graphical representations of possible relationships between ecosystem function and species richness. The two solid dots represent the end points of a continuum of species richness. The first dot is at the origin, where there are no species and no community services. The second dot represents a natural level of species richness. The relationship is strongest in (a) and weakest in (d).
Want to see the full answer?
Check out a sample textbook solution
Chapter 60 Solutions
Biology
- Explain how the hormones of the glands listed below travel around the body to target organs and tissues : Pituitary gland Hypothalamus Thyroid Parathyroid Adrenal Pineal Pancreas(islets of langerhans) Gonads (testes and ovaries) Placentaarrow_forwardWhat are the functions of the hormones produced in the glands listed below: Pituitary gland Hypothalamus Thyroid Parathyroid Adrenal Pineal Pancreas(islets of langerhans) Gonads (testes and ovaries) Placentaarrow_forwardDescribe the hormones produced in the glands listed below: Pituitary gland Hypothalamus Thyroid Parathyroid Adrenal Pineal Pancreas(islets of langerhans) Gonads (testes and ovaries) Placentaarrow_forward
- Please help me calculate drug dosage from the following information: Patient weight: 35 pounds, so 15.9 kilograms (got this by dividing 35 pounds by 2.2 kilograms) Drug dose: 0.05mg/kg Drug concentration: 2mg/mLarrow_forwardA 25-year-old woman presents to the emergency department with a 2-day history of fever, chills, severe headache, and confusion. She recently returned from a trip to sub-Saharan Africa, where she did not take malaria prophylaxis. On examination, she is febrile (39.8°C/103.6°F) and hypotensive. Laboratory studies reveal hemoglobin of 8.0 g/dL, platelet count of 50,000/μL, and evidence of hemoglobinuria. A peripheral blood smear shows ring forms and banana-shaped gametocytes. Which of the following Plasmodium species is most likely responsible for her severe symptoms? A. Plasmodium vivax B. Plasmodium ovale C. Plasmodium malariae D. Plasmodium falciparumarrow_forwardStandard Concentration (caffeine) mg/L Absorbance Reading 10 0.322 20 0.697 40 1.535 60 2.520 80 3.100arrow_forward
- please draw in the answers, thank youarrow_forwarda. On this first grid, assume that the DNA and RNA templates are read left to right. DNA DNA mRNA codon tRNA anticodon polypeptide _strand strand C с A T G A U G C A TRP b. Now do this AGAIN assuming that the DNA and RNA templates are read right to left. DNA DNA strand strand C mRNA codon tRNA anticodon polypeptide 0 A T G A U G с A TRParrow_forwardplease answer all question below with the following answer choice, thank you!arrow_forward
 Biology 2eBiologyISBN:9781947172517Author:Matthew Douglas, Jung Choi, Mary Ann ClarkPublisher:OpenStax
 Biology: The Dynamic Science (MindTap Course List)BiologyISBN:9781305389892Author:Peter J. Russell, Paul E. Hertz, Beverly McMillanPublisher:Cengage Learning
- Case Studies In Health Information ManagementBiologyISBN:9781337676908Author:SCHNERINGPublisher:Cengage
 Biology (MindTap Course List)BiologyISBN:9781337392938Author:Eldra Solomon, Charles Martin, Diana W. Martin, Linda R. BergPublisher:Cengage Learning


