
Videos
In addition to the key words, you should also be able to define each of the following terms:
descriptive research strategy
linear relationship
curvilinear relationship
positive relationship
correlational research strategy
experimental research strategy
quasi-experimental research strategy
nonexperimental research strategy
selection bias
volunteer bias
novelty effect
multiple treatment interference
sensitization, or assessment sensitization, or pretest
sensitization
participant variables
time-related variables
fatigue
practice
artifact
experimenter bias
single-blind
double-blind
demand characteristics
reactivity
laboratory
field
To define:
The following terms:
- Descriptive Research Strategy
- Linear relationship
- Curvilinear Relationship
- Positive Relationship
- Negative Relationship
- Correlational Research Strategy
- Experimental Research Strategy
- Quasi-Experimental Research Strategy
- Non-Experimental Research Strategy
- Selection Bias
- Volunteer Bias
- Novelty Effect
- Multiple Treatment Interference
- Sensitization/Assessment Sensitization/ Pretest Sensitization
- Participant Variable
- Time-Related Variable
- Fatigue
- Practice
- Artifact
- Experimenter Bias
- Single-Blind
- Double-Blind
- Demand Characteristics
- Reactivity
- Laboratory
- Field
Explanation of Solution
Descriptive Research Strategy:
This strategy gives the description of single variable, that is, how it is varying according to time or situation. In other words, one can say that this is a strategy which is used in research to describe the variables. This strategy is used to know the behaviour of any variable and does not work for the causes behind the variation in it.
Linear relationship:
A linear relationship between any two variables can be defined as the relationship which can be represented by a line on a graph. Mathematically, a relationship between the variables x and y which satisfies the equation-
Where m is a slope and c represents intercept.
Curvilinear Relationship:
If the linear relationship does not exist between two variables then there would be another relationship, known as a curvilinear relationship, that is, the relationship except the linear relationship between the two variables is known as curvilinear relationship.
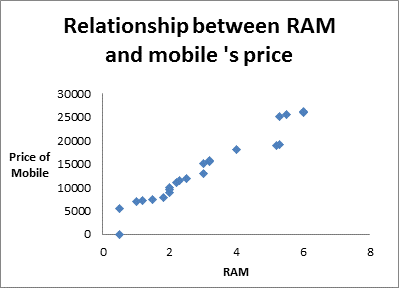
Positive Relationship:
In statistics, a positive relationship or positive correlation is defined as the relationship between two variables in which, increment (decrement) in one variable results in increment(decrement) of other variable (not necessarily in same ratio). In other words, positive relationship is the relationship between the two variables in which both variable moves in same direction.
For example, increment in RAM results in increment in price of mobile. The positive relationship can also be seen graphically through scatter plot.
Negative Relationship:
In statistical terms, a negative relationship or negative correlation is defined as the relationship between two variables in which both the variables move in opposite direction, that is, increment(decrement) in the value of one variable results in decrement (increment) of other.
For example, on increasing the temperature of microwave, the time taken by water to boil is decreased.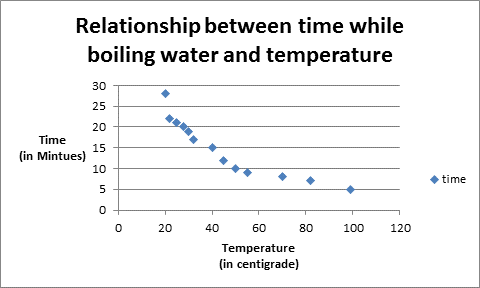
Correlational Research Strategy:
The research strategy used to find the relationship between two variables is known as correlational research strategy. It tells whether the relationship exists or not and if exists then which kind of relationship exists, that is, the nature of relationship. It can be seen by scatter plot which is a graphical representation of variables. Correlation is not same as causation.
Experimental Research Strategy:
The research study which gives the cause and effect relationship between the two variables is known as experimental research strategy. In this type of study, one does changes in a variable which is known as independent variable and the dependent variable is measured at different levels of the independent variable and the remaining variables are known as extraneous variables. Here, manipulation in independent variable is used to determine the direction of a relationship and comparison of dependent variable is done at each level of treatment and one controls the effect of extraneous variables as much as possible through randomization technique.
Quasi-Experimental Research Strategy:
A quasi-experimental research strategy is not a true experimental research strategy but it is between correlational and experimental research strategy. In this strategy, the problem of controlling extraneous variable is not eliminated but the problem of directionality is solved. In this, participants are not randomly assigned to experimental groups.
Non-Experimental Research Strategy:
A research strategy in which independent variable cannot be manipulated or random assignment is not possible is known as non-experimental research strategy. In this type of study, sometimes one has to deal with a problem of single variable or the problem of non causal relationship between variables or the problem may be about a particular experience. Some kinds of non-experimental research are correlational research, quasi-experimental research, single-variable research and qualitative research.
Selection Bias:
As the name 'selection bias' sounds that it is the bias in selection, that is, when the selection of units is not done randomly then it is not a good representative of population and it affects the analysis. So, the main purpose of analysis is not fulfilled when the units in the sample are not chosen randomly. For example, sometimes in interviews, the interviewer do bias in selecting candidates.
Volunteer Bias:
A volunteer bias occurs when the when sample members are self-selected. For example, if teacher asks to students to participate in sports event, then some of the students come to teacher and tell that they want to participate in sports event then they are volunteers and here randomization does not play any role so this type of bias is known as selection bias.
Novelty Effect:
Novelty effect arises due to something new which means that when there is an effect of any new thing occurs or changes in environment then people get boosted for some time and there will be novelty effect. For example, when the online shopping apps came into our lives then suddenly people love to use those apps because of saving of time and some other reasons. The people got attract to online shopping and this was the change for them. So, here the novelty effect kicked in.
Multiple Treatment Interference:
When the multiple treatments are given to the same subjects and effect of one treatment may be influenced by other treatment, this process is known as multiple treatment interference.
Sensitization/Assessment Sensitization/ Pretest Sensitization:
Sensitization is the process of making someone react to something that previously had no effect or in other words, the process of being sensitive towards any specific event.
When the participants involved in the experiment are pretested then there is a risk that they will be sensitive towards the variables which is measured by pretesting and that will affect their post-test scores, this is pretest sensitization.
Participant Variable:
Participant variables are the extraneous variables which describe the individual's characteristics that may impact how he or she responds such as age, anxiety, awareness or intelligence etc. These are known as extraneous variables because these variables can affect the experiment but the experimenter may not consider it.
Time-Related Variable:
It is clear by the name 'time-related variable' that the variables which varies with the time such as price of mobiles, temperature over a day etc. These types of variables are very useful in time-series analysis and in research study too.
Fatigue:
Fatigue means extreme tiredness which occurs without taking rest over a period of time whether from physical or mental illness. Fatigue is a process that has a degree of randomness and is influenced by variety of factors. The most common distributions in data analysis which works against fatigue are Weibull distribution, lognormal distribution and extreme value distribution.
Practice:
It is a threat to internal validity that occurs when prior participation in a measurement provides additional skills that influence their performance on subsequent measurements.
Artifact:
In statistics, artifact is a noise or error which occurs during data manipulation or in the case of selection of faulty choice of variables. It threats the validity of measurement and is an external factor.
Experimenter Bias:
During an experiment, the thoughts of a researcher affect the experiment and it can occur at any phase of research. This is known as experimenter bias. It is very difficult to leave subjectivity completely for anyone because of which this bias arises.
Single-Blind:
When a researcher gives any treatment or medication to a subject and that subject is not aware about the treatment or medication which he/she is receiving is known as single-blind study.
Double-Blind:
When a subject as well as researcher is not aware of the treatment then the study is called as double-blind study. This type of study is used to remove the bias by keeping both the persons unaware about what is being tested.
Demand Characteristics:
In research, demand characteristics are artifact which occurs when the subject is aware about the treatment which they are receiving and then they change their behaviour which affects the outcome of the research.
Reactivity:
Reactivity refers to the behaviour of subject which changes during the experiment when they get affected by any instrument during experiment and this may create bias.
Laboratory:
Laboratory term refers to observing the behaviour of the subject that is observed in controlled atmosphere. For example, a teacher can observe a student in a classroom which is controlled atmosphere and also in playground during holidays which is an uncontrolled atmosphere. So, as a teacher, she/he can get nearly accurate result about student in a class.
Field:
In statistics, field can be defined as the place from where one can collect primary data by using various methods such as personal interview, direct investigation etc.
Want to see more full solutions like this?
Chapter 6 Solutions
Research Methods for the Behavioral Sciences (MindTap Course List)


- 1. A consumer group claims that the mean annual consumption of cheddar cheese by a person in the United States is at most 10.3 pounds. A random sample of 100 people in the United States has a mean annual cheddar cheese consumption of 9.9 pounds. Assume the population standard deviation is 2.1 pounds. At a = 0.05, can you reject the claim? (Adapted from U.S. Department of Agriculture) State the hypotheses: Calculate the test statistic: Calculate the P-value: Conclusion (reject or fail to reject Ho): 2. The CEO of a manufacturing facility claims that the mean workday of the company's assembly line employees is less than 8.5 hours. A random sample of 25 of the company's assembly line employees has a mean workday of 8.2 hours. Assume the population standard deviation is 0.5 hour and the population is normally distributed. At a = 0.01, test the CEO's claim. State the hypotheses: Calculate the test statistic: Calculate the P-value: Conclusion (reject or fail to reject Ho): Statisticsarrow_forward21. find the mean. and variance of the following: Ⓒ x(t) = Ut +V, and V indepriv. s.t U.VN NL0, 63). X(t) = t² + Ut +V, U and V incepires have N (0,8) Ut ①xt = e UNN (0162) ~ X+ = UCOSTE, UNNL0, 62) SU, Oct ⑤Xt= 7 where U. Vindp.rus +> ½ have NL, 62). ⑥Xn = ΣY, 41, 42, 43, ... Yn vandom sample K=1 Text with mean zen and variance 6arrow_forwardA psychology researcher conducted a Chi-Square Test of Independence to examine whether there is a relationship between college students’ year in school (Freshman, Sophomore, Junior, Senior) and their preferred coping strategy for academic stress (Problem-Focused, Emotion-Focused, Avoidance). The test yielded the following result: image.png Interpret the results of this analysis. In your response, clearly explain: Whether the result is statistically significant and why. What this means about the relationship between year in school and coping strategy. What the researcher should conclude based on these findings.arrow_forward
- A school counselor is conducting a research study to examine whether there is a relationship between the number of times teenagers report vaping per week and their academic performance, measured by GPA. The counselor collects data from a sample of high school students. Write the null and alternative hypotheses for this study. Clearly state your hypotheses in terms of the correlation between vaping frequency and academic performance. EditViewInsertFormatToolsTable 12pt Paragrapharrow_forwardA smallish urn contains 25 small plastic bunnies – 7 of which are pink and 18 of which are white. 10 bunnies are drawn from the urn at random with replacement, and X is the number of pink bunnies that are drawn. (a) P(X = 5) ≈ (b) P(X<6) ≈ The Whoville small urn contains 100 marbles – 60 blue and 40 orange. The Grinch sneaks in one night and grabs a simple random sample (without replacement) of 15 marbles. (a) The probability that the Grinch gets exactly 6 blue marbles is [ Select ] ["≈ 0.054", "≈ 0.043", "≈ 0.061"] . (b) The probability that the Grinch gets at least 7 blue marbles is [ Select ] ["≈ 0.922", "≈ 0.905", "≈ 0.893"] . (c) The probability that the Grinch gets between 8 and 12 blue marbles (inclusive) is [ Select ] ["≈ 0.801", "≈ 0.760", "≈ 0.786"] . The Whoville small urn contains 100 marbles – 60 blue and 40 orange. The Grinch sneaks in one night and grabs a simple random sample (without replacement) of 15 marbles. (a)…arrow_forwardSuppose an experiment was conducted to compare the mileage(km) per litre obtained by competing brands of petrol I,II,III. Three new Mazda, three new Toyota and three new Nissan cars were available for experimentation. During the experiment the cars would operate under same conditions in order to eliminate the effect of external variables on the distance travelled per litre on the assigned brand of petrol. The data is given as below: Brands of Petrol Mazda Toyota Nissan I 10.6 12.0 11.0 II 9.0 15.0 12.0 III 12.0 17.4 13.0 (a) Test at the 5% level of significance whether there are signi cant differences among the brands of fuels and also among the cars. [10] (b) Compute the standard error for comparing any two fuel brands means. Hence compare, at the 5% level of significance, each of fuel brands II, and III with the standard fuel brand I. [10] �arrow_forward
- Analyze the residuals of a linear regression model and select the best response. yes, the residual plot does not show a curve no, the residual plot shows a curve yes, the residual plot shows a curve no, the residual plot does not show a curve I answered, "No, the residual plot shows a curve." (and this was incorrect). I am not sure why I keep getting these wrong when the answer seems obvious. Please help me understand what the yes and no references in the answer.arrow_forwarda. Find the value of A.b. Find pX(x) and py(y).c. Find pX|y(x|y) and py|X(y|x)d. Are x and y independent? Why or why not?arrow_forwardAnalyze the residuals of a linear regression model and select the best response.Criteria is simple evaluation of possible indications of an exponential model vs. linear model) no, the residual plot does not show a curve yes, the residual plot does not show a curve yes, the residual plot shows a curve no, the residual plot shows a curve I selected: yes, the residual plot shows a curve and it is INCORRECT. Can u help me understand why?arrow_forward
 Big Ideas Math A Bridge To Success Algebra 1: Stu...AlgebraISBN:9781680331141Author:HOUGHTON MIFFLIN HARCOURTPublisher:Houghton Mifflin Harcourt
 Linear Algebra: A Modern IntroductionAlgebraISBN:9781285463247Author:David PoolePublisher:Cengage Learning
 Glencoe Algebra 1, Student Edition, 9780079039897...AlgebraISBN:9780079039897Author:CarterPublisher:McGraw Hill