
Concept explainers
Videos
You conduct a poll in which you randomly select 1000 registered voters from Texas and ask if they approve of the job their governor is doing. The population for this study is
a. all registered voters in the state of Texas.
b. the 1000 people that you interview.
c. the governor of Texas.
What is meant by Population of a study.
Answer to Problem 1QQ
Solution:
a. All registered voters in the state of Texas.
Explanation of Solution
Given:
Here in our question a poll is conducted by randomly selecting 1000 registered voters from Texas and ask if they approve of the job of their Governor is Doing.
Explanation:
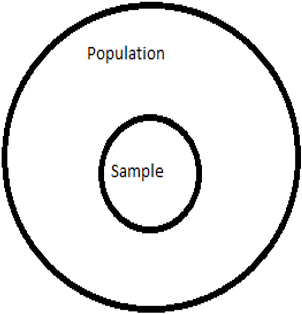
In any statistical survey we select a bunch of people from the entire pool and conduct our survey on them and we try to estimate the actual parameter. The bunch of people we select is known as Sample and the entire pool of people from which the Sample is selected is known as Population.
For Example: If I want to know who is going to win in next election for mayor in a city, I select randomly a set of people from all different streets of the city and ask them who is going to win among Mr. X and Mr. Y. So, who ever got the majority of votes from the people we selected, I conclude that person is going to win the next mayor election. So here the bunch of people selected are known as Sample and All the people who can vote in the city are known to be the Population.
Conclusion:
So here the selected 1000 registered voters from Texas whom we asked about Governor is our Sample and our Sample is selected from entire registered voters in Texas. So, all registered voters in Texas is our Population.
Want to see more full solutions like this?
Chapter 5 Solutions
Using and Understanding Mathematics: A Quantitative Reasoning Approach (6th Edition)
Additional Math Textbook Solutions
Algebra and Trigonometry (6th Edition)
Elementary Statistics (13th Edition)
Basic Business Statistics, Student Value Edition
Elementary Statistics: Picturing the World (7th Edition)
College Algebra with Modeling & Visualization (5th Edition)


- If you were asked to load 225 boxes onto a truck, and the boxes are crated, with each crate containing nine boxes, how many crates would you need to load?arrow_forwardForce with 800 N and 400 N are acting on a machine part at 30° and 60°, respectively with the positive x axisarrow_forward2. The duration of the ride is 15 min. (a) How many times does the last passenger who boarded the ride make a complete loop on the Ferris wheel? (b) What is the position of that passenger when the ride ends?arrow_forward
- Find the accumulated amount A, if the principal P is invested at an interest rate of r per year for t years. (Round your answer to the nearest cent.) P = $13,000, r = 6%, t = 10, compounded quarterly A = $ 31902 Need Help? Read It Watch It Viewing Saved Work Revert to Last Response SUBMIT ANSWER O/6.66 Points] DETAILS MY NOTES TANAPCALC10 5.3.003. EVIOUS ANSWERS ASK YOUR TEACHER PRACTICE ANOTHER Find the accumulated amount A, if the principal P is invested at an interest rate of r per year for t years. (Round your answer to the nearest cent.) P = $140,000, r = 8%, t = 8, compounded monthly A = $259130.20 X Need Help? Read It Watch Itarrow_forwardFind the present value of $20,000 due in 3 years at the given rate of interest. (Round your answers to the nearest cent.) (a) 2%/year compounded monthly (b) 5%/year compounded daily $ Need Help? Read It Watch It SUBMIT ANSWER [-/6.66 Points] DETAILS MY NOTES TANAPCALC10 5.3.009. ASK YOUR TEACHER PRACTICE ANC Find the accumulated amount after 3 years if $4000 is invested at 3%/year compounded continuously. (Round your answer to the nearest cent.) Need Help? Read It Watch Itarrow_forwardFind the effective rate corresponding to the given nominal rate. (Round your answers to three decimal places.) (a) 9.5%/year compounded monthly % (b) 9.5%/year compounded daily % Need Help? Read It Watch It SUBMIT ANSWER -/6.66 Points] DETAILS MY NOTES TANAPCALC10 5.3.007. ASK YOUR TEACHE Find the present value of $90,000 due in 7 years at the given rate of interest. (Round your answers to the nearest cent.) (a) 9%/year compounded semiannually (b) 9%/year compounded quarterly LAarrow_forward
- Find the accumulated amount A, if the principal P is invested at an interest rate of r per year for t years. (Round your answer to the nearest cent.) P = $160,000, r = 7%, t = 4, compounded daily A = $211113.60 Need Help? Read It SUBMIT ANSWER ASK YOUR TEACHER PRACTICE ANOTHER --/6.66 Points] DETAILS MY NOTES TANAPCALC10 5.3.005. Find the effective rate corresponding to the given nominal rate. (Round your answers to three decimal places.) (a) 8%/year compounded semiannually % (b) 9%/year compounded quarterly %arrow_forward3. A scientist recorded the movement of a pendulum for 10 s. The scientist began recording when the pendulum was at its resting position. The pendulum then moved right (positive displacement) and left (negative displacement) several times. The pendulum took 4 s to swing to the right and the left and then return to its resting position. The pendulum's furthest distance to either side was 6 in. Graph the function that represents the pendulum's displacement as a function of time. Answer: f(t) (a) Write an equation to represent the displacement of the pendulum as a function of time. (b) Graph the function. 10 9 8 7 6 5 4 3 2 1 0 t 1 2 3 4 5 6 7 8 9 10 11 12 13 14 15 -1 -5. -6 -7 -8 -9 -10-arrow_forwardFind the derivative of the function. g'(t) = 9t g(t) = In(t) (9ln(t) - 1) [In(t)] 2 × Need Help? Read It Watch Itarrow_forward
- A power outage occurs 6 min after the ride started. Passengers must wait for their cage to be manually cranked into the lowest position in order to exit the ride. Sine function model: h = −82.5 cos (3πt) + 97.5 where h is the height of the last passenger above the ground measured in feet and t is the time of operation of the ride in minutes. (a) What is the height of the last passenger at the moment of the power outage? Verify your answer by evaluating the sine function model. (b) Will the last passenger to board the ride need to wait in order to exit the ride? Explain.arrow_forwardFind the accumulated amount A, if the principal P is invested at an interest rate of r per year for t years. (Round your answer to the nearest cent.) P = $3800, r = 4%, t = 10, compounded semiannually A = $ 5645.60 × Need Help? Read It SUBMIT ANSWER [3.33/6.66 Points] DETAILS MY NOTES REVIOUS ANSWERS ASK YOUR TEACHER TANAPCALC10 5.3.001.EP. PRACTICE ANOTHER Consider the following where the principal P is invested at an interest rate of r per year for t years. P = $3,100, r = 4%, t = 10, compounded semiannually Determine m, the number of conversion periods per year. 2 Find the accumulated amount A (in dollars). (Round your answer to the nearest cent.) A = $ 4604.44arrow_forwardThe Colossus Ferris wheel debuted at the 1984 New Orleans World's Fair. The ride is 180 ft tall, and passengers board the ride at an initial height of 15 ft above the ground. The height above ground, h, of a passenger on the ride is a periodic function of time, t. The graph displays the height above ground of the last passenger to board over the course of the 15 min ride. Height of Passenger in Ferris Wheel 180 160 140- €120 Height, h (ft) 100 80 60 40 20 0 ך 1 2 3 4 5 6 7 8 9 10 11 12 13 14 15 Time of operation, t (min) Sine function model: h = −82.5 cos (3πt) + 97.5 where h is the height of the passenger above the ground measured in feet and t is the time of operation of the ride in minutes. What is the period of the sine function model? Interpret the period you found in the context of the operation of the Ferris wheel. Answer:arrow_forward
 Holt Mcdougal Larson Pre-algebra: Student Edition...AlgebraISBN:9780547587776Author:HOLT MCDOUGALPublisher:HOLT MCDOUGAL
 Big Ideas Math A Bridge To Success Algebra 1: Stu...AlgebraISBN:9781680331141Author:HOUGHTON MIFFLIN HARCOURTPublisher:Houghton Mifflin Harcourt
 Glencoe Algebra 1, Student Edition, 9780079039897...AlgebraISBN:9780079039897Author:CarterPublisher:McGraw Hill
 College Algebra (MindTap Course List)AlgebraISBN:9781305652231Author:R. David Gustafson, Jeff HughesPublisher:Cengage Learning
 Functions and Change: A Modeling Approach to Coll...AlgebraISBN:9781337111348Author:Bruce Crauder, Benny Evans, Alan NoellPublisher:Cengage Learning