
Pearson eText for Elementary Statistics: Picturing the World -- Instant Access (Pearson+)
7th Edition
ISBN: 9780137504329
Author: Ron Larson, Betsy Farber
Publisher: PEARSON+
expand_more
expand_more
format_list_bulleted
Concept explainers
Videos
Textbook Question
Chapter 5.1, Problem 1TY
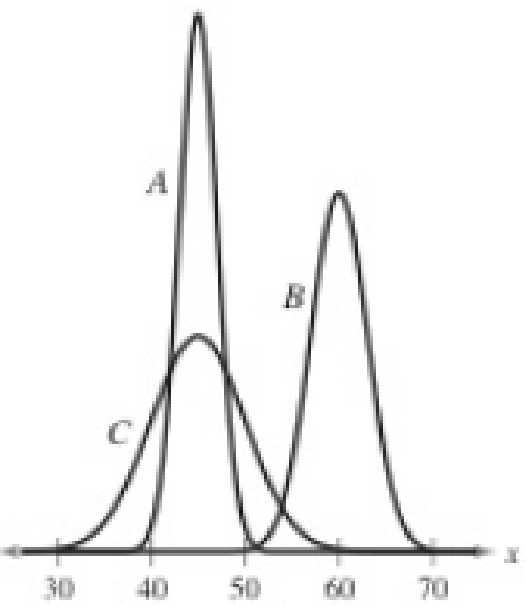
- 1. Which normal curve has the greatest mean?
- 2. Which normal curve has the greatest standard deviation?
Expert Solution & Answer

Trending nowThis is a popular solution!

Learn your wayIncludes step-by-step video

schedule01:12
Students have asked these similar questions
Find binomial probability if:
x = 8, n = 10, p = 0.7
x= 3, n=5, p = 0.3
x = 4, n=7, p = 0.6
Quality Control: A factory produces light bulbs with a 2% defect rate. If a random sample of 20 bulbs is tested, what is the probability that exactly 2 bulbs are defective? (hint: p=2% or 0.02; x =2, n=20; use the same logic for the following problems)
Marketing Campaign: A marketing company sends out 1,000 promotional emails. The probability of any email being opened is 0.15. What is the probability that exactly 150 emails will be opened? (hint: total emails or n=1000, x =150)
Customer Satisfaction: A survey shows that 70% of customers are satisfied with a new product. Out of 10 randomly selected customers, what is the probability that at least 8 are satisfied? (hint: One of the keyword in this question is “at least 8”, it is not “exactly 8”, the correct formula for this should be = 1- (binom.dist(7, 10, 0.7, TRUE)). The part in the princess will give you the probability of seven and less than…
please answer these questions
Selon une économiste d’une société financière, les dépenses moyennes pour « meubles et appareils de maison » ont été moins importantes pour les ménages de la région de Montréal, que celles de la région de Québec.
Un échantillon aléatoire de 14 ménages pour la région de Montréal et de 16 ménages pour la région Québec est tiré et donne les données suivantes, en ce qui a trait aux dépenses pour ce secteur d’activité économique.
On suppose que les données de chaque population sont distribuées selon une loi normale.
Nous sommes intéressé à connaitre si les variances des populations sont égales.a) Faites le test d’hypothèse sur deux variances approprié au seuil de signification de 1 %. Inclure les informations suivantes :
i. Hypothèse / Identification des populationsii. Valeur(s) critique(s) de Fiii. Règle de décisioniv. Valeur du rapport Fv. Décision et conclusion
b) A partir des résultats obtenus en a), est-ce que l’hypothèse d’égalité des variances pour cette…
Chapter 5 Solutions
Pearson eText for Elementary Statistics: Picturing the World -- Instant Access (Pearson+)
Ch. 5.1 - 1. Which normal curve has the greatest mean? 2....Ch. 5.1 - The scaled test scores for the New York State...Ch. 5.1 - A U.S. adult who is at least 20 years old is...Ch. 5.1 - Find the area under the standard normal curve to...Ch. 5.1 - Find the area under the standard normal curve to...Ch. 5.1 - Find the area under the standard normal curve...Ch. 5.1 - Find three real-life examples of a continuous...Ch. 5.1 - In a normal distribution, which is greater, the...Ch. 5.1 - What is the total area under the normal curve?Ch. 5.1 - What do the inflection points on a normal...
Ch. 5.1 - Draw two normal curves that have the same mean but...Ch. 5.1 - Draw two normal curves that have different means...Ch. 5.1 - What is the mean of the standard normal...Ch. 5.1 - Describe how you can transform a nonstandard...Ch. 5.1 - Getting at the Concept Why is it correct to say a...Ch. 5.1 - Getting at the Concept A z-score is 0. Which of...Ch. 5.1 - Graphical Analysis In Exercises 1116, determine...Ch. 5.1 - Graphical Analysis In Exercises 1116, determine...Ch. 5.1 - Graphical Analysis In Exercises 1116, determine...Ch. 5.1 - Graphical Analysis In Exercises 1116, determine...Ch. 5.1 - Graphical Analysis In Exercises 1116, determine...Ch. 5.1 - Graphical Analysis In Exercises 1116, determine...Ch. 5.1 - Finding Area In Exercises 1722, find the area of...Ch. 5.1 - Finding Area In Exercises 1722, find the area of...Ch. 5.1 - Finding Area In Exercises 1722, find the area of...Ch. 5.1 - Finding Area In Exercises 1722, find the area of...Ch. 5.1 - Finding Area In Exercises 1722, find the area of...Ch. 5.1 - Finding Area In Exercises 1722, find the area of...Ch. 5.1 - Finding Area In Exercises 2336, find the indicated...Ch. 5.1 - Finding Area In Exercises 2336, find the indicated...Ch. 5.1 - Finding Area In Exercises 2336, find the indicated...Ch. 5.1 - Finding Area In Exercises 2336, find the indicated...Ch. 5.1 - Finding Area In Exercises 2336, find the indicated...Ch. 5.1 - Finding Area In Exercises 2336, find the indicated...Ch. 5.1 - Finding Area In Exercises 2336, find the indicated...Ch. 5.1 - Finding Area In Exercises 2336, find the indicated...Ch. 5.1 - Finding Area In Exercises 2336, find the indicated...Ch. 5.1 - Finding Area In Exercises 2336, find the indicated...Ch. 5.1 - Finding Area In Exercises 2336, find the indicated...Ch. 5.1 - Finding Area In Exercises 2336, find the indicated...Ch. 5.1 - Finding Area In Exercises 2336, find the indicated...Ch. 5.1 - Finding Area In Exercises 2336, find the indicated...Ch. 5.1 - Manufacturer Claims You work for a consumer...Ch. 5.1 - Milk Consumption You are performing a study about...Ch. 5.1 - Computing and Interpreting z-Scores In Exercises...Ch. 5.1 - Computing and Interpreting z-Scores In Exercises...Ch. 5.1 - Finding Probability In Exercises 4146, find the...Ch. 5.1 - Finding Probability In Exercises 4146, find the...Ch. 5.1 - Finding Probability In Exercises 4146, find the...Ch. 5.1 - Finding Probability In Exercises 4146, find the...Ch. 5.1 - Finding Probability In Exercises 4146, find the...Ch. 5.1 - Finding Probability In Exercises 4146, find the...Ch. 5.1 - Finding Probability In Exercises 4756, find the...Ch. 5.1 - Finding Probability In Exercises 4756, find the...Ch. 5.1 - Finding Probability In Exercises 4756, find the...Ch. 5.1 - Finding Probability In Exercises 4756, find the...Ch. 5.1 - Finding Probability In Exercises 4756, find the...Ch. 5.1 - Finding Probability In Exercises 4756, find the...Ch. 5.1 - Finding Probability In Exercises 4756, find the...Ch. 5.1 - Finding Probability In Exercises 4756, find the...Ch. 5.1 - Finding Probability In Exercises 4756, find the...Ch. 5.1 - Finding Probability In Exercises 4756, find the...Ch. 5.1 - Writing Draw a normal curve with a mean of 60 and...Ch. 5.1 - Writing Draw a normal curve with a mean of 450 and...Ch. 5.1 - Prob. 59ECh. 5.1 - Uniform Distribution A uniform distribution is a...Ch. 5.2 - The average speed of vehicles traveling on a...Ch. 5.2 - What is the probability that the shopper in...Ch. 5.2 - Find the cumulative area that corresponds to a...Ch. 5.2 - Computing Probabilities for Normal Distributions...Ch. 5.2 - Computing Probabilities for Normal Distributions...Ch. 5.2 - Computing Probabilities for Normal Distributions...Ch. 5.2 - Computing Probabilities for Normal Distributions...Ch. 5.2 - Computing Probabilities for Normal Distributions...Ch. 5.2 - Computing Probabilities for Normal Distributions...Ch. 5.2 - Finding Probabilities for Normal Distributions In...Ch. 5.2 - Finding Probabilities for Normal Distributions In...Ch. 5.2 - Finding Probabilities for Normal Distributions In...Ch. 5.2 - Finding Probabilities for Normal Distributions In...Ch. 5.2 - Finding Probabilities for Normal Distributions In...Ch. 5.2 - Finding Probabilities for Normal Distributions In...Ch. 5.2 - Graphical Analysis In Exercises 1316, a member is...Ch. 5.2 - Graphical Analysis In Exercises 1316, a member is...Ch. 5.2 - Graphical Analysis In Exercises 1316, a member is...Ch. 5.2 - Graphical Analysis In Exercises 1316, a member is...Ch. 5.2 - Using Normal Distributions In Exercises 1720,...Ch. 5.2 - Using Normal Distributions In Exercises 1720,...Ch. 5.2 - Using Normal Distributions In Exercises 1720,...Ch. 5.2 - Using Normal Distributions In Exercises 1720,...Ch. 5.2 - In Exercises 2124, a control chart is shown. Each...Ch. 5.2 - In Exercises 2124, a control chart is shown. Each...Ch. 5.2 - In Exercises 2124, a control chart is shown. Each...Ch. 5.2 - In Exercises 2124, a control chart is shown. Each...Ch. 5.3 - 1. Find the z-score that has 96.16% of the...Ch. 5.3 - Find the z-score that corresponds to each...Ch. 5.3 - A veterinarian records the weights of dogs treated...Ch. 5.3 - A researcher tests the braking distances of...Ch. 5.3 - The lengths of time employees have worked at a...Ch. 5.3 - Finding a z-Score In Exercises 116, use the...Ch. 5.3 - Finding a z-Score In Exercises 116, use the...Ch. 5.3 - Prob. 3ECh. 5.3 - Finding a z-Score In Exercises 116, use the...Ch. 5.3 - Prob. 5ECh. 5.3 - Prob. 6ECh. 5.3 - Prob. 7ECh. 5.3 - Finding a z-Score In Exercises 116, use the...Ch. 5.3 - Prob. 9ECh. 5.3 - Finding a z-Score In Exercises 116, use the...Ch. 5.3 - Finding a z-Score In Exercises 116, use the...Ch. 5.3 - Finding a z-Score In Exercises 116, use the...Ch. 5.3 - Prob. 13ECh. 5.3 - Prob. 14ECh. 5.3 - Prob. 15ECh. 5.3 - Prob. 16ECh. 5.3 - Graphical Analysis In Exercises 1722, find the...Ch. 5.3 - Graphical Analysis In Exercises 1722, find the...Ch. 5.3 - Prob. 19ECh. 5.3 - Graphical Analysis In Exercises 1722, find the...Ch. 5.3 - Graphical Analysis In Exercises 1722, find the...Ch. 5.3 - Graphical Analysis In Exercises 1722, find the...Ch. 5.3 - Finding a z-Score Given an Area In Exercises 2330,...Ch. 5.3 - Finding a z-Score Given an Area In Exercises 2330,...Ch. 5.3 - Finding a z-Score Given an Area In Exercises 2330,...Ch. 5.3 - Finding a z-Score Given an Area In Exercises 2330,...Ch. 5.3 - Finding a z-Score Given an Area In Exercises 2330,...Ch. 5.3 - Finding a z-Score Given an Area In Exercises 2330,...Ch. 5.3 - Find the positive z-score for which 80% of the...Ch. 5.3 - Find the positive z-score for which 12% of the...Ch. 5.3 - Finding Specified Data Values In Exercises 3138,...Ch. 5.3 - Finding Specified Data Values In Exercises 3138,...Ch. 5.3 - Finding Specified Data Values In Exercises 3138,...Ch. 5.3 - Finding Specified Data Values In Exercises 3138,...Ch. 5.3 - Undergraduate Grade Point Average The...Ch. 5.3 - GRE Scores The test scores for the analytical...Ch. 5.3 - Finding Specified Data Values In Exercises 3138,...Ch. 5.3 - Finding Specified Data Values In Exercises 3138,...Ch. 5.3 - Bags of Baby Carrots The weights of bags of baby...Ch. 5.3 - Writing a Guarantee You sell a brand of automobile...Ch. 5.3 - Vending Machine A vending machine dispenses coffee...Ch. 5.3 - History Grades In a large section of a history...Ch. 5.3 - CASE STUDY Birth Weights in America The National...Ch. 5.3 - CASE STUDY Birth Weights in America The National...Ch. 5.3 - CASE STUDY Birth Weights in America The National...Ch. 5.3 - CASE STUDY Birth Weights in America The National...Ch. 5.3 - Prob. 5CSCh. 5.4 - List all possible samples of size n = 3. with...Ch. 5.4 - Random samples of size 64 are drawn from the...Ch. 5.4 - The diameters of fully grown white oak trees are...Ch. 5.4 - You randomly select 100 drivers ages 16 to 19 from...Ch. 5.4 - The average sales price of a single-family house...Ch. 5.4 - A consumer price analyst claims that prices for...Ch. 5.4 - In Exercises 14, a population has a mean and a...Ch. 5.4 - In Exercises 14, a population has a mean and a...Ch. 5.4 - In Exercises 14, a population has a mean and a...Ch. 5.4 - In Exercises 14, a population has a mean and a...Ch. 5.4 - True or False? In Exercises 58, determine whether...Ch. 5.4 - True or False? In Exercises 58, determine whether...Ch. 5.4 - True or False? In Exercises 58, determine whether...Ch. 5.4 - True or False? In Exercises 58, determine whether...Ch. 5.4 - Graphical Analysis In Exercises 9 and 10, the...Ch. 5.4 - Graphical Analysis In Exercises 9 and 10, the...Ch. 5.4 - A Sampling Distribution of Sample Means In...Ch. 5.4 - A Sampling Distribution of Sample Means In...Ch. 5.4 - A Sampling Distribution of Sample Means In...Ch. 5.4 - A Sampling Distribution of Sample Means In...Ch. 5.4 - Finding Probabilities In Exercises 1518, the...Ch. 5.4 - Finding Probabilities In Exercises 1518, the...Ch. 5.4 - Finding Probabilities In Exercises 1518, the...Ch. 5.4 - Finding Probabilities In Exercises 1518, the...Ch. 5.4 - Interpreting the Central Limit Theorem In...Ch. 5.4 - Interpreting the Central Limit Theorem In...Ch. 5.4 - Interpreting the Central Limit Theorem In...Ch. 5.4 - Interpreting the Central Limit Theorem In...Ch. 5.4 - Interpreting the Central Limit Theorem In...Ch. 5.4 - Interpreting the Central Limit Theorem In...Ch. 5.4 - Interpreting the Central Limit Theorem In...Ch. 5.4 - Interpreting the Central Limit Theorem In...Ch. 5.4 - Repeat Exercise 19 for samples of size 40 and 60....Ch. 5.4 - Repeat Exercise 20 for samples of size 72 and 108....Ch. 5.4 - Finding Probabilities for Sampling Distributions...Ch. 5.4 - Finding Probabilities for Sampling Distributions...Ch. 5.4 - Finding Probabilities for Sampling Distributions...Ch. 5.4 - Finding Probabilities for Sampling Distributions...Ch. 5.4 - Which Is More Likely? Assume that the childhood...Ch. 5.4 - Which Is More Likely? Assume that the carbon...Ch. 5.4 - Paint Cans A machine is set to fill paint cans...Ch. 5.4 - Milk Containers A machine is set to fill milk...Ch. 5.4 - Finding Probabilities for Sampling Distributions...Ch. 5.4 - Finding Probabilities for Sampling Distributions...Ch. 5.4 - In Exercises 39 and 40, determine whether the...Ch. 5.4 - In Exercises 39 and 40, determine whether the...Ch. 5.4 - Sampling Distribution of Sample Proportions For a...Ch. 5.4 - Sampling Distribution of Sample Proportions For a...Ch. 5.4 - Run the simulation using n = 30 and N = 10 for a...Ch. 5.4 - Run the simulation using n = 50 and N = 10 for a...Ch. 5.5 - A binomial experiment is listed. Determine whether...Ch. 5.5 - Use a continuity correction to convert each...Ch. 5.5 - In a survey of adults in the United States, 29%...Ch. 5.5 - In Example 4, what is the probability that at most...Ch. 5.5 - The study in Example 5 found that 32.0% of all men...Ch. 5.5 - In Exercises 14, the sample size n,. probability...Ch. 5.5 - In Exercises 14, the sample size n,. probability...Ch. 5.5 - Prob. 3ECh. 5.5 - Prob. 4ECh. 5.5 - In Exercises 5-8, match the binomial probability...Ch. 5.5 - In Exercises 5-8, match the binomial probability...Ch. 5.5 - In Exercises 5-8, match the binomial probability...Ch. 5.5 - In Exercises 5-8, match the binomial probability...Ch. 5.5 - In Exercises 9-14, write the binomial probability...Ch. 5.5 - In Exercises 9-14, write the binomial probability...Ch. 5.5 - In Exercises 9-14, write the binomial probability...Ch. 5.5 - In Exercises 9-14, write the binomial probability...Ch. 5.5 - In Exercises 9-14, write the binomial probability...Ch. 5.5 - In Exercises 9-14, write the binomial probability...Ch. 5.5 - Graphical Analysis In Exercises 15 and 16, write...Ch. 5.5 - Graphical Analysis In Exercises 15 and 16, write...Ch. 5.5 - Approximating a Binomial Distribution In Exercises...Ch. 5.5 - Approximating a Binomial Distribution In Exercises...Ch. 5.5 - Approximating Binomial Probabilities In Exercises...Ch. 5.5 - Approximating Binomial Probabilities In Exercises...Ch. 5.5 - Approximating Binomial Probabilities In Exercises...Ch. 5.5 - Approximating Binomial Probabilities In Exercises...Ch. 5.5 - Approximating Binomial Probabilities In Exercises...Ch. 5.5 - Approximating Binomial Probabilities In Exercises...Ch. 5.5 - Approximating Binomial Probabilities In Exercises...Ch. 5.5 - Approximating Binomial Probabilities In Exercises...Ch. 5.5 - Minimum Wage About 3.3% of hourly paid U.S....Ch. 5.5 - Education A survey of U.S. adults found that 8%...Ch. 5.5 - Getting Physical The figure shows the results of a...Ch. 5.5 - Getting Physical The figure shows the results of a...Ch. 5.5 - Testing a Drug A drug manufacturer claims that a...Ch. 5.5 - Testing a Drug A drug manufacturer claims that a...Ch. 5 - Is It Unusual? A population is normally...Ch. 5 - Find the Error The mean age of students at a high...Ch. 5 - Give an example of a distribution that might be...Ch. 5 - In Exercises I and 2, use the normal curve to...Ch. 5 - In Exercises I and 2, use the normal curve to...Ch. 5 - In Exercises 3 and 4, use the normal curves shown...Ch. 5 - Prob. 5.1.4RECh. 5 - In Exercises 5 and 6, find the area of the...Ch. 5 - In Exercises 5 and 6, find the area of the...Ch. 5 - In Exercises 7-18, find the indicated area under...Ch. 5 - In Exercises 7-18, find the indicated area under...Ch. 5 - In Exercises 7-18, find the indicated area under...Ch. 5 - In Exercises 7-18, find the indicated area under...Ch. 5 - In Exercises 7-18, find the indicated area under...Ch. 5 - In Exercises 7-18, find the indicated area under...Ch. 5 - In Exercises 7-18, find the indicated area under...Ch. 5 - In Exercises 7-18, find the indicated area under...Ch. 5 - In Exercises 7-18, find the indicated area under...Ch. 5 - In Exercises 7-18, find the indicated area under...Ch. 5 - In Exercises 7-18, find the indicated area under...Ch. 5 - In Exercises 7-18, find the indicated area under...Ch. 5 - The scores for the reading portion of the ACT test...Ch. 5 - The scores for the reading portion of the ACT test...Ch. 5 - In Exercises 21-26, find the indicated probability...Ch. 5 - In Exercises 21-26, find the indicated probability...Ch. 5 - In Exercises 21-26, find the indicated probability...Ch. 5 - In Exercises 21-26, find the indicated probability...Ch. 5 - In Exercises 21-26, find the indicated probability...Ch. 5 - In Exercises 21-26, find the indicated probability...Ch. 5 - In Exercises 2732, the random variable x is...Ch. 5 - In Exercises 2732, the random variable x is...Ch. 5 - In Exercises 2732, the random variable x is...Ch. 5 - In Exercises 2732, the random variable x is...Ch. 5 - In Exercises 2732, the random variable x is...Ch. 5 - In Exercises 2732, the random variable x is...Ch. 5 - In Exercises 33 and 34, find the indicated...Ch. 5 - In Exercises 33 and 34, find the indicated...Ch. 5 - Determine whether any of the events in Exercise 33...Ch. 5 - Determine whether any of the events in Exercise 34...Ch. 5 - In Exercises 3742, use the Standard Normal Table...Ch. 5 - In Exercises 3742, use the Standard Normal Table...Ch. 5 - In Exercises 3742, use the Standard Normal Table...Ch. 5 - In Exercises 3742, use the Standard Normal Table...Ch. 5 - In Exercises 3742, use the Standard Normal Table...Ch. 5 - In Exercises 3742, use the Standard Normal Table...Ch. 5 - In Exercises 3742, use the Standard Normal Table...Ch. 5 - In Exercises 3742, use the Standard Normal Table...Ch. 5 - On a dry surface, the braking distances (in feet),...Ch. 5 - On a dry surface, the braking distances (in feet),...Ch. 5 - Prob. 5.3.47RECh. 5 - On a dry surface, the braking distances (in feet),...Ch. 5 - On a dry surface, the braking distances (in feet),...Ch. 5 - Prob. 5.3.50RECh. 5 - In Exercises 51 and 52, a population and sample...Ch. 5 - In Exercises 51 and 52, a population and sample...Ch. 5 - Prob. 5.4.53RECh. 5 - Prob. 5.4.54RECh. 5 - In Exercises 5560, find the indicated...Ch. 5 - In Exercises 5560, find the indicated...Ch. 5 - In Exercises 5560, find the indicated...Ch. 5 - In Exercises 5560, find the indicated...Ch. 5 - Prob. 5.4.59RECh. 5 - Prob. 5.4.60RECh. 5 - Prob. 5.5.61RECh. 5 - Prob. 5.5.62RECh. 5 - In Exercises 63-68, write the binomial probability...Ch. 5 - In Exercises 63-68, write the binomial probability...Ch. 5 - In Exercises 63-68, write the binomial probability...Ch. 5 - In Exercises 63-68, write the binomial probability...Ch. 5 - In Exercises 63-68, write the binomial probability...Ch. 5 - Prob. 5.5.68RECh. 5 - In Exercises 69 and 70, determine whether you can...Ch. 5 - In Exercises 69 and 70, determine whether you can...Ch. 5 - Find each probability using the standard normal...Ch. 5 - The random variable x is normally distributed with...Ch. 5 - In a standardized IQ test, scores are normally...Ch. 5 - In a standardized IQ test, scores are normally...Ch. 5 - In a standardized IQ test, scores are normally...Ch. 5 - In a standardized IQ test, scores are normally...Ch. 5 - In a standardized IQ test, scores are normally...Ch. 5 - In a standardized IQ test, scores are normally...Ch. 5 - In a standardized IQ test, scores are normally...Ch. 5 - Are you more likely to randomly select one person...Ch. 5 - In a survey of U.S. adults, 16% say they have had...Ch. 5 - In a survey of U.S. adults, 16% say they have had...Ch. 5 - Prob. 1CTCh. 5 - In Exercises 2-4, the random variable x is...Ch. 5 - In Exercises 2-4, the random variable x is...Ch. 5 - In Exercises 2-4, the random variable x is...Ch. 5 - In Exercises 5 and 6. determine whether you can...Ch. 5 - In Exercises 5 and 6. determine whether you can...Ch. 5 - The per capita disposable income for residents of...Ch. 5 - The per capita disposable income for residents of...Ch. 5 - The per capita disposable income for residents of...Ch. 5 - The per capita disposable income for residents of...Ch. 5 - EXERCISES 1. Sampling Individuals Assume the...Ch. 5 - Sampling Groups of Five Assume the machine shifts...Ch. 5 - Writing an Explanation Write a paragraph to your...Ch. 5 - A survey of adults in the United States found that...Ch. 5 - Prob. 2CRCh. 5 - In Exercises 2 and 3, find the (a) mean, (b)...Ch. 5 - Use the probability distribution in Exercise 3 to...Ch. 5 - From a pool of 16 candidates, 9 men and 7 women,...Ch. 5 - In Exercises 6-11, find the indicated area under...Ch. 5 - In Exercises 6-11, find the indicated area under...Ch. 5 - In Exercises 6-11, find the indicated area under...Ch. 5 - In Exercises 6-11, find the indicated area under...Ch. 5 - Prob. 10CRCh. 5 - In Exercises 6-11, find the indicated area under...Ch. 5 - Twenty-eight percent of U.S. adults think that...Ch. 5 - Prob. 13CRCh. 5 - Prob. 14CRCh. 5 - A survey of adults in the United States found that...Ch. 5 - The life spans of car batteries are normally...Ch. 5 - A florist has 12 different flowers from which...Ch. 5 - Seventy percent of U.S. adults anticipate major...
Additional Math Textbook Solutions
Find more solutions based on key concepts
Views on Capital Punishment In carrying out a study of views on capital punishment, a student asked a question ...
Introductory Statistics
Keplers wine barrel Several mathematical stories originated with the second wedding of the mathematician and as...
Calculus: Early Transcendentals (2nd Edition)
CHECK POINT I You deposit $1000 in a saving account at a bank that has a rate of 4%. a. Find the amount, A, of ...
Thinking Mathematically (6th Edition)
The conjugate of 43i is _______. (p. A59)
Precalculus
In Exercises 13–16, find the margin of error for the values of c, ?, and n.
13. c = 0.95, ? = 5.2, n = 30
Elementary Statistics: Picturing the World (7th Edition)
The scatter plot as mentioned in the table. yearNo. of student190016192022194025196035198042200047
Pre-Algebra Student Edition
Knowledge Booster


Learn more about
Need a deep-dive on the concept behind this application? Look no further. Learn more about this topic, statistics and related others by exploring similar questions and additional content below.Similar questions
- According to an economist from a financial company, the average expenditures on "furniture and household appliances" have been lower for households in the Montreal area than those in the Quebec region. A random sample of 14 households from the Montreal region and 16 households from the Quebec region was taken, providing the following data regarding expenditures in this economic sector. It is assumed that the data from each population are distributed normally. We are interested in knowing if the variances of the populations are equal. a) Perform the appropriate hypothesis test on two variances at a significance level of 1%. Include the following information: i. Hypothesis / Identification of populations ii. Critical F-value(s) iii. Decision rule iv. F-ratio value v. Decision and conclusion b) Based on the results obtained in a), is the hypothesis of equal variances for this socio-economic characteristic measured in these two populations upheld? c) Based on the results obtained in a),…arrow_forwardA major company in the Montreal area, offering a range of engineering services from project preparation to construction execution, and industrial project management, wants to ensure that the individuals who are responsible for project cost estimation and bid preparation demonstrate a certain uniformity in their estimates. The head of civil engineering and municipal services decided to structure an experimental plan to detect if there could be significant differences in project evaluation. Seven projects were selected, each of which had to be evaluated by each of the two estimators, with the order of the projects submitted being random. The obtained estimates are presented in the table below. a) Complete the table above by calculating: i. The differences (A-B) ii. The sum of the differences iii. The mean of the differences iv. The standard deviation of the differences b) What is the value of the t-statistic? c) What is the critical t-value for this test at a significance level of 1%?…arrow_forwardCompute the relative risk of falling for the two groups (did not stop walking vs. did stop). State/interpret your result verbally.arrow_forward
- Microsoft Excel include formulasarrow_forwardQuestion 1 The data shown in Table 1 are and R values for 24 samples of size n = 5 taken from a process producing bearings. The measurements are made on the inside diameter of the bearing, with only the last three decimals recorded (i.e., 34.5 should be 0.50345). Table 1: Bearing Diameter Data Sample Number I R Sample Number I R 1 34.5 3 13 35.4 8 2 34.2 4 14 34.0 6 3 31.6 4 15 37.1 5 4 31.5 4 16 34.9 7 5 35.0 5 17 33.5 4 6 34.1 6 18 31.7 3 7 32.6 4 19 34.0 8 8 33.8 3 20 35.1 9 34.8 7 21 33.7 2 10 33.6 8 22 32.8 1 11 31.9 3 23 33.5 3 12 38.6 9 24 34.2 2 (a) Set up and R charts on this process. Does the process seem to be in statistical control? If necessary, revise the trial control limits. [15 pts] (b) If specifications on this diameter are 0.5030±0.0010, find the percentage of nonconforming bearings pro- duced by this process. Assume that diameter is normally distributed. [10 pts] 1arrow_forward4. (5 pts) Conduct a chi-square contingency test (test of independence) to assess whether there is an association between the behavior of the elderly person (did not stop to talk, did stop to talk) and their likelihood of falling. Below, please state your null and alternative hypotheses, calculate your expected values and write them in the table, compute the test statistic, test the null by comparing your test statistic to the critical value in Table A (p. 713-714) of your textbook and/or estimating the P-value, and provide your conclusions in written form. Make sure to show your work. Did not stop walking to talk Stopped walking to talk Suffered a fall 12 11 Totals 23 Did not suffer a fall | 2 Totals 35 37 14 46 60 Tarrow_forward
- Question 2 Parts manufactured by an injection molding process are subjected to a compressive strength test. Twenty samples of five parts each are collected, and the compressive strengths (in psi) are shown in Table 2. Table 2: Strength Data for Question 2 Sample Number x1 x2 23 x4 x5 R 1 83.0 2 88.6 78.3 78.8 3 85.7 75.8 84.3 81.2 78.7 75.7 77.0 71.0 84.2 81.0 79.1 7.3 80.2 17.6 75.2 80.4 10.4 4 80.8 74.4 82.5 74.1 75.7 77.5 8.4 5 83.4 78.4 82.6 78.2 78.9 80.3 5.2 File Preview 6 75.3 79.9 87.3 89.7 81.8 82.8 14.5 7 74.5 78.0 80.8 73.4 79.7 77.3 7.4 8 79.2 84.4 81.5 86.0 74.5 81.1 11.4 9 80.5 86.2 76.2 64.1 80.2 81.4 9.9 10 75.7 75.2 71.1 82.1 74.3 75.7 10.9 11 80.0 81.5 78.4 73.8 78.1 78.4 7.7 12 80.6 81.8 79.3 73.8 81.7 79.4 8.0 13 82.7 81.3 79.1 82.0 79.5 80.9 3.6 14 79.2 74.9 78.6 77.7 75.3 77.1 4.3 15 85.5 82.1 82.8 73.4 71.7 79.1 13.8 16 78.8 79.6 80.2 79.1 80.8 79.7 2.0 17 82.1 78.2 18 84.5 76.9 75.5 83.5 81.2 19 79.0 77.8 20 84.5 73.1 78.2 82.1 79.2 81.1 7.6 81.2 84.4 81.6 80.8…arrow_forwardName: Lab Time: Quiz 7 & 8 (Take Home) - due Wednesday, Feb. 26 Contingency Analysis (Ch. 9) In lab 5, part 3, you will create a mosaic plot and conducted a chi-square contingency test to evaluate whether elderly patients who did not stop walking to talk (vs. those who did stop) were more likely to suffer a fall in the next six months. I have tabulated the data below. Answer the questions below. Please show your calculations on this or a separate sheet. Did not stop walking to talk Stopped walking to talk Totals Suffered a fall Did not suffer a fall Totals 12 11 23 2 35 37 14 14 46 60 Quiz 7: 1. (2 pts) Compute the odds of falling for each group. Compute the odds ratio for those who did not stop walking vs. those who did stop walking. Interpret your result verbally.arrow_forwardSolve please and thank you!arrow_forward
- 7. In a 2011 article, M. Radelet and G. Pierce reported a logistic prediction equation for the death penalty verdicts in North Carolina. Let Y denote whether a subject convicted of murder received the death penalty (1=yes), for the defendant's race h (h1, black; h = 2, white), victim's race i (i = 1, black; i = 2, white), and number of additional factors j (j = 0, 1, 2). For the model logit[P(Y = 1)] = a + ß₁₂ + By + B²², they reported = -5.26, D â BD = 0, BD = 0.17, BY = 0, BY = 0.91, B = 0, B = 2.02, B = 3.98. (a) Estimate the probability of receiving the death penalty for the group most likely to receive it. [4 pts] (b) If, instead, parameters used constraints 3D = BY = 35 = 0, report the esti- mates. [3 pts] h (c) If, instead, parameters used constraints Σ₁ = Σ₁ BY = Σ; B = 0, report the estimates. [3 pts] Hint the probabilities, odds and odds ratios do not change with constraints.arrow_forwardSolve please and thank you!arrow_forwardSolve please and thank you!arrow_forward
arrow_back_ios
SEE MORE QUESTIONS
arrow_forward_ios
Recommended textbooks for you
 Glencoe Algebra 1, Student Edition, 9780079039897...AlgebraISBN:9780079039897Author:CarterPublisher:McGraw Hill
Glencoe Algebra 1, Student Edition, 9780079039897...
Algebra
ISBN:9780079039897
Author:Carter
Publisher:McGraw Hill
The Shape of Data: Distributions: Crash Course Statistics #7; Author: CrashCourse;https://www.youtube.com/watch?v=bPFNxD3Yg6U;License: Standard YouTube License, CC-BY
Shape, Center, and Spread - Module 20.2 (Part 1); Author: Mrmathblog;https://www.youtube.com/watch?v=COaid7O_Gag;License: Standard YouTube License, CC-BY
Shape, Center and Spread; Author: Emily Murdock;https://www.youtube.com/watch?v=_YyW0DSCzpM;License: Standard Youtube License