
Essentials of Statistics (6th Edition)
6th Edition
ISBN: 9780134685779
Author: Mario F. Triola
Publisher: PEARSON
expand_more
expand_more
format_list_bulleted
Concept explainers
Videos
Textbook Question
Chapter 5.1, Problem 1BSC
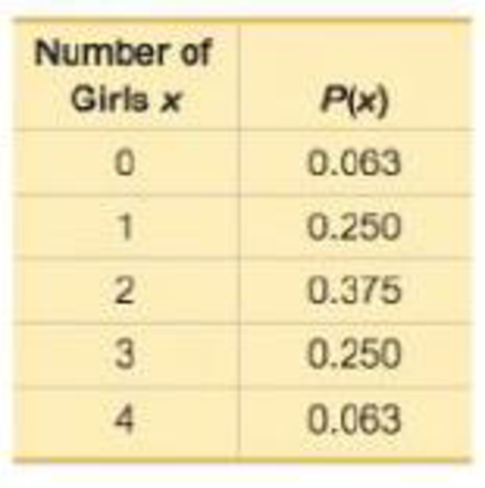
Random Variable The accompanying table lists probabilities for the corresponding numbers of girls in four births. What is the random variable, what are its possible values, and are its values numerical?
Number of Girls in Four Births
Expert Solution & Answer

Learn your wayIncludes step-by-step video

schedule01:48
Students have asked these similar questions
NC Current Students - North Ce X | NC Canvas Login Links - North ( X
Final Exam Comprehensive x Cengage Learning
x
WASTAT - Final Exam - STAT
→
C
webassign.net/web/Student/Assignment-Responses/submit?dep=36055360&tags=autosave#question3659890_9
Part (b)
Draw a scatter plot of the ordered pairs.
N
Life
Expectancy
Life
Expectancy
80
70
600
50
40
30
20
10
Year of
1950
1970 1990
2010 Birth
O
Life
Expectancy
Part (c)
800
70
60
50
40
30
20
10
1950
1970 1990
W
ALT
林
$
#
4
R
J7
Year of
2010 Birth
F6
4+
80
70
60
50
40
30
20
10
Year of
1950 1970 1990
2010 Birth
Life
Expectancy
Ox
800
70
60
50
40
30
20
10
Year of
1950 1970 1990 2010 Birth
hp
P.B.
KA
&
7
80
% 5
H
A
B
F10
711
N
M
K
744
PRT SC
ALT
CTRL
Harvard University
California Institute of Technology
Massachusetts Institute of Technology
Stanford University
Princeton University
University of Cambridge
University of Oxford
University of California, Berkeley
Imperial College London
Yale University
University of California, Los Angeles
University of Chicago
Johns Hopkins University
Cornell University
ETH Zurich
University of Michigan
University of Toronto
Columbia University
University of Pennsylvania
Carnegie Mellon University
University of Hong Kong
University College London
University of Washington
Duke University
Northwestern University
University of Tokyo
Georgia Institute of Technology
Pohang University of Science and Technology
University of California, Santa Barbara
University of British Columbia
University of North Carolina at Chapel Hill
University of California, San Diego
University of Illinois at Urbana-Champaign
National University of Singapore
McGill…
Name
Harvard University
California Institute of Technology
Massachusetts Institute of Technology
Stanford University
Princeton University
University of Cambridge
University of Oxford
University of California, Berkeley
Imperial College London
Yale University
University of California, Los Angeles
University of Chicago
Johns Hopkins University
Cornell University
ETH Zurich
University of Michigan
University of Toronto
Columbia University
University of Pennsylvania
Carnegie Mellon University
University of Hong Kong
University College London
University of Washington
Duke University
Northwestern University
University of Tokyo
Georgia Institute of Technology
Pohang University of Science and Technology
University of California, Santa Barbara
University of British Columbia
University of North Carolina at Chapel Hill
University of California, San Diego
University of Illinois at Urbana-Champaign
National University of Singapore…
Chapter 5 Solutions
Essentials of Statistics (6th Edition)
Ch. 5.1 - Random Variable The accompanying table lists...Ch. 5.1 - Discrete or Continuous? Is the random variable...Ch. 5.1 - Probability Distribution For the accompanying...Ch. 5.1 - Significant For 100 births, P(exactly 56 girls) =...Ch. 5.1 - Identifying Discrete and Continuous Random...Ch. 5.1 - Identifying Discrete and Continuous Random...Ch. 5.1 - Identifying Probability Distributions. In...Ch. 5.1 - Identifying Probability Distributions. In...Ch. 5.1 - Identifying Probability Distributions. In...Ch. 5.1 - Identifying Probability Distributions. In...
Ch. 5.1 - Identifying Probability Distributions. In...Ch. 5.1 - Identifying Probability Distributions. In...Ch. 5.1 - Identifying Probability Distributions. In...Ch. 5.1 - Identifying Probability Distributions. In...Ch. 5.1 - Genetics. In Exercises 1520, refer to the...Ch. 5.1 - Genetics. In Exercises 1520, refer to the...Ch. 5.1 - Genetics. In Exercises 1520, refer to the...Ch. 5.1 - Genetics. In Exercises 1520, refer to the...Ch. 5.1 - Genetics. In Exercises 1520, refer to the...Ch. 5.1 - Genetics. In Exercises 1520, refer to the...Ch. 5.1 - Sleepwalking. In Exercises 2125, refer to the...Ch. 5.1 - Sleepwalking. In Exercises 2125, refer to the...Ch. 5.1 - Sleepwalking. In Exercises 2125, refer to the...Ch. 5.1 - Sleepwalking. In Exercises 2125, refer to the...Ch. 5.1 - Sleepwalking. In Exercises 2125, refer to the...Ch. 5.1 - Expected Value for the Ohio Pick 4 Lottery In the...Ch. 5.1 - Expected Value in Virginias Pick 3 Game In...Ch. 5.1 - Expected Value in Roulette When playing roulette...Ch. 5.1 - Expected Value for Life Insurance There is a...Ch. 5.1 - Expected Value for Life Insurance There is a...Ch. 5.2 - Drone Deliveries Based on a Pitney Bowes survey,...Ch. 5.2 - Notation Assume that we want to find the...Ch. 5.2 - Independent Events Based on a Pitney Bowes survey,...Ch. 5.2 - Notation of 0 + Using the same survey from...Ch. 5.2 - Identifying Binomial Distributions. In Exercises...Ch. 5.2 - Identifying Binomial Distributions. In Exercises...Ch. 5.2 - Identifying Binomial Distributions. In Exercises...Ch. 5.2 - Identifying Binomial Distributions. In Exercises...Ch. 5.2 - Identifying Binomial Distributions. In Exercises...Ch. 5.2 - Identifying Binomial Distributions. In Exercises...Ch. 5.2 - Identifying Binomial Distributions. In Exercises...Ch. 5.2 - Identifying Binomial Distributions. In Exercises...Ch. 5.2 - Binomial Probability Formula. In Exercises 13 and...Ch. 5.2 - News Source Based on data from a Harris...Ch. 5.2 - SAT Test. In Exercises 1520, assume that random...Ch. 5.2 - SAT Test. In Exercises 1520, assume that random...Ch. 5.2 - SAT Test. In Exercises 1520, assume that random...Ch. 5.2 - SAT Test. In Exercises 1520, assume that random...Ch. 5.2 - SAT Test. In Exercises 1520, assume that random...Ch. 5.2 - SAT Test. In Exercises 1520, assume that random...Ch. 5.2 - In Exercises 2124, assume that when adults with...Ch. 5.2 - In Exercises 2124, assume that when adults with...Ch. 5.2 - In Exercises 2124, assume that when adults with...Ch. 5.2 - In Exercises 2124, assume that when adults with...Ch. 5.2 - Whitus v. Georgia In the classic legal case of...Ch. 5.2 - Vision Correction A survey sponsored by the Vision...Ch. 5.2 - See You Later Based on a Harris Interactive poll,...Ch. 5.2 - Too Young to Tat Based on a Harris poll, among...Ch. 5.2 - Significance with Range Rule of Thumb. In...Ch. 5.2 - Significance with Range Rule of Thumb. In...Ch. 5.2 - Significance with Range Rule of Thumb. In...Ch. 5.2 - Hybrids Assume that offspring peas are randomly...Ch. 5.2 - Composite Sampling. Exercises 33 and 34 involve...Ch. 5.2 - Anemia Based on data from Bloodjournal.org, 10% of...Ch. 5.2 - Acceptance Sampling. Exercises 35 and 36 involve...Ch. 5.2 - AAA Batteries AAA batteries are made by companies...Ch. 5.2 - MMs Data Set 27 MM Weights in Appendix B includes...Ch. 5.2 - Politics The County Clerk in Essex, New Jersey,...Ch. 5.2 - Perception and Reality In a presidential election,...Ch. 5.2 - Hybrids One of Mendels famous experiments with...Ch. 5.2 - Geometric Distribution If a procedure meets all...Ch. 5.2 - Multinomial Distribution The binomial distribution...Ch. 5.2 - Hypergeometric Distribution If we sample from a...Ch. 5.3 - Notation In analyzing hits by V-1 buzz bombs in...Ch. 5.3 - Tornadoes During a recent 64-year period, New...Ch. 5.3 - Poisson Probability Distribution The random...Ch. 5.3 - Probability if 0 For Formula 5-9, what does P(0)...Ch. 5.3 - Hurricanes. In Exercises 58, assume that the...Ch. 5.3 - Hurricanes a. Find the probability that in a year,...Ch. 5.3 - Hurricanes a. Find the probability that in a year,...Ch. 5.3 - Hurricanes a. Find the probability that in a year,...Ch. 5.3 - In Exercises 916, use the Poisson distribution to...Ch. 5.3 - Murders In a recent year, there were 333 murders...Ch. 5.3 - Radioactive Decay Radioactive atoms are unstable...Ch. 5.3 - Deaths from Horse Kicks A classical example of the...Ch. 5.3 - World War II Bombs In Exercise 1Notation we noted...Ch. 5.3 - Disease Cluster Neuroblastoma, a rare form of...Ch. 5.3 - Car Fatalities The recent rate of car fatalities...Ch. 5.3 - Checks In a recent year, the author wrote 181...Ch. 5.3 - Powerball: Poisson Approximation to Binomial There...Ch. 5 - Is a probability distribution defined if the only...Ch. 5 - There are 80 questions from an SAT test, and they...Ch. 5 - Are the values Found in Exercise 2 statistics or...Ch. 5 - Using the same SAT questions described in Exercise...Ch. 5 - Using the same SAT questions described in Exercise...Ch. 5 - In Exercises 610, use the following: Five American...Ch. 5 - In Exercises 610, use the following: Five American...Ch. 5 - Based on the table, the standard deviation is 0.9...Ch. 5 - 9. What does the probability of 0+ indicate? Does...Ch. 5 - In Exercises 6-10, use the following: Five...Ch. 5 - In Exercises 15, assume that 74% of randomly...Ch. 5 - In Exercises 15, assume that 74% of randomly...Ch. 5 - In Exercises 15, assume that 74% of randomly...Ch. 5 - In Exercises 15, assume that 74% of randomly...Ch. 5 - In Exercises 15, assume that 74% of randomly...Ch. 5 - Security Survey In a USA Today poll, subjects were...Ch. 5 - Brand Recognition In a study of brand recognition...Ch. 5 - Family/Partner Groups of people aged 1565 are...Ch. 5 - Detecting Fraud The Brooklyn District Attorneys...Ch. 5 - Poisson: Deaths Currently, an average of 7...Ch. 5 - Planets The planets of the solar system have the...Ch. 5 - South Carolina Pick 3 In South Carolinas Pick 3...Ch. 5 - Tennis Challenge In a recent U.S. Open tennis...Ch. 5 - Job Applicants The Society for Human Resource...Ch. 5 - Bar Graph Fox News broadcast a graph similar to...Ch. 5 - Washing Hands Based on results from a Bradley...Ch. 5 - Overbooking Flights American Airlines Flight 171...Ch. 5 - Critical Thinking: Did Mendels results from plant...
Additional Math Textbook Solutions
Find more solutions based on key concepts
8. Effect of Blinding Among 13,200 submitted abstracts that were blindly evaluated (with authors and institutio...
Elementary Statistics
Matching In Exercises 17–20, match the level of confidence c with the appropriate confidence interval. Assume e...
Elementary Statistics: Picturing the World (7th Edition)
Choose your test Use the test of your choice to determine whether the following series converge. 49. k=31lnk
Calculus: Early Transcendentals (2nd Edition)
Whether 22 is prime or composite number.
Pre-Algebra Student Edition
Fill in each blanks so that the resulting statement is true. Any set of ordered pairs is called a/an _______. T...
College Algebra (7th Edition)
Knowledge Booster


Learn more about
Need a deep-dive on the concept behind this application? Look no further. Learn more about this topic, statistics and related others by exploring similar questions and additional content below.Similar questions
- A company found that the daily sales revenue of its flagship product follows a normal distribution with a mean of $4500 and a standard deviation of $450. The company defines a "high-sales day" that is, any day with sales exceeding $4800. please provide a step by step on how to get the answers in excel Q: What percentage of days can the company expect to have "high-sales days" or sales greater than $4800? Q: What is the sales revenue threshold for the bottom 10% of days? (please note that 10% refers to the probability/area under bell curve towards the lower tail of bell curve) Provide answers in the yellow cellsarrow_forwardFind the critical value for a left-tailed test using the F distribution with a 0.025, degrees of freedom in the numerator=12, and degrees of freedom in the denominator = 50. A portion of the table of critical values of the F-distribution is provided. Click the icon to view the partial table of critical values of the F-distribution. What is the critical value? (Round to two decimal places as needed.)arrow_forwardA retail store manager claims that the average daily sales of the store are $1,500. You aim to test whether the actual average daily sales differ significantly from this claimed value. You can provide your answer by inserting a text box and the answer must include: Null hypothesis, Alternative hypothesis, Show answer (output table/summary table), and Conclusion based on the P value. Showing the calculation is a must. If calculation is missing,so please provide a step by step on the answers Numerical answers in the yellow cellsarrow_forward
arrow_back_ios
SEE MORE QUESTIONS
arrow_forward_ios
Recommended textbooks for you

 Holt Mcdougal Larson Pre-algebra: Student Edition...AlgebraISBN:9780547587776Author:HOLT MCDOUGALPublisher:HOLT MCDOUGAL
 Algebra and Trigonometry (MindTap Course List)AlgebraISBN:9781305071742Author:James Stewart, Lothar Redlin, Saleem WatsonPublisher:Cengage Learning
 College AlgebraAlgebraISBN:9781305115545Author:James Stewart, Lothar Redlin, Saleem WatsonPublisher:Cengage Learning
 College Algebra (MindTap Course List)AlgebraISBN:9781305652231Author:R. David Gustafson, Jeff HughesPublisher:Cengage Learning
Holt Mcdougal Larson Pre-algebra: Student Edition...
Algebra
ISBN:9780547587776
Author:HOLT MCDOUGAL
Publisher:HOLT MCDOUGAL
Algebra and Trigonometry (MindTap Course List)
Algebra
ISBN:9781305071742
Author:James Stewart, Lothar Redlin, Saleem Watson
Publisher:Cengage Learning
College Algebra
Algebra
ISBN:9781305115545
Author:James Stewart, Lothar Redlin, Saleem Watson
Publisher:Cengage Learning
College Algebra (MindTap Course List)
Algebra
ISBN:9781305652231
Author:R. David Gustafson, Jeff Hughes
Publisher:Cengage Learning
Mod-01 Lec-01 Discrete probability distributions (Part 1); Author: nptelhrd;https://www.youtube.com/watch?v=6x1pL9Yov1k;License: Standard YouTube License, CC-BY
Discrete Probability Distributions; Author: Learn Something;https://www.youtube.com/watch?v=m9U4UelWLFs;License: Standard YouTube License, CC-BY
Probability Distribution Functions (PMF, PDF, CDF); Author: zedstatistics;https://www.youtube.com/watch?v=YXLVjCKVP7U;License: Standard YouTube License, CC-BY
Discrete Distributions: Binomial, Poisson and Hypergeometric | Statistics for Data Science; Author: Dr. Bharatendra Rai;https://www.youtube.com/watch?v=lHhyy4JMigg;License: Standard Youtube License