Concept explainers
Videos
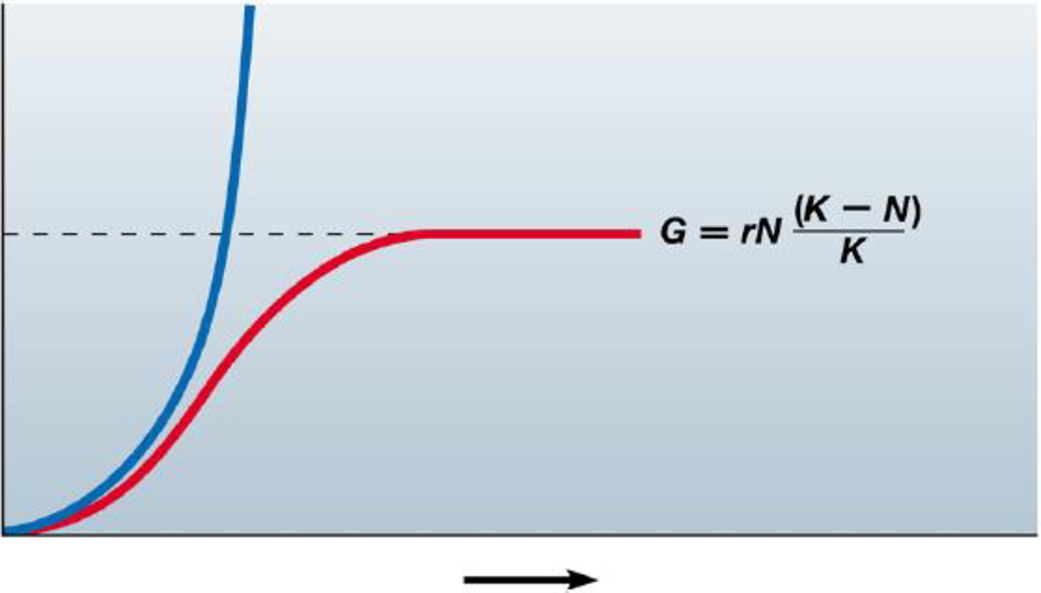
Use this graph of the idealized exponential and
a. Label the axes and curves on the graph.
b. Give the formula that describes the blue curve.
c. What does the dotted line represent?
d. For each curve, indicate and explain where population growth is the most rapid.
e. Which of these curves best represents global human population growth?
a.
To label: The axis and the curves of the graph.
Introduction: Exponential growth curve is the J-shaped curve that is ever increasing in nature. The logistic growth curve is an S shaped curve in which the growth of the population ceases after a certain point which can be represented as the carrying capacity of the population.
Answer to Problem 1CC
Correct answer:
X-axis is time, Y-axis is population size. Blue/thick curve is the exponential growth and red/thin curve is logistic curve
Explanation of Solution
Graphical representation: Fig: 1 shows the graph depicting the logistic and exponential growth curve.
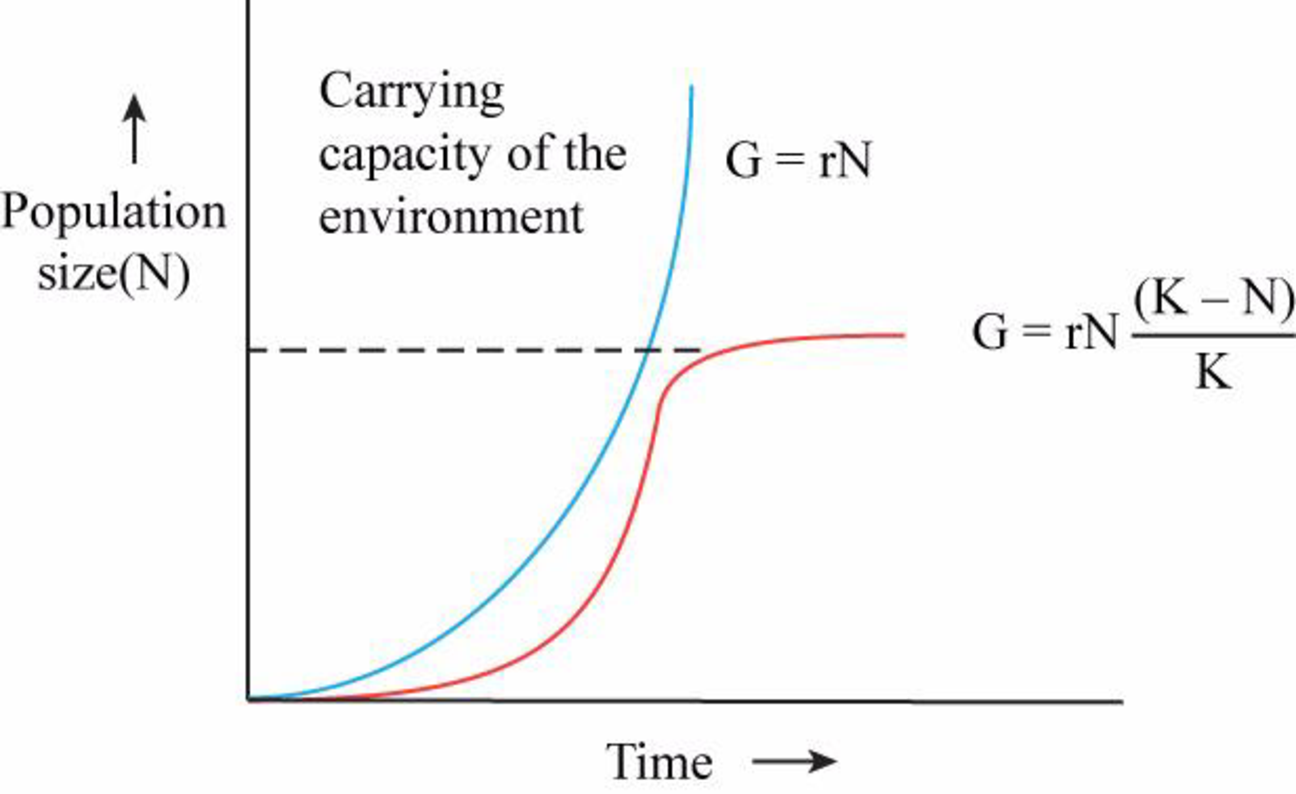
Fig. 1: The graph depicting the logistic and exponential growth curve.
The X-axis of the graph represents the time taken for growth and the Y-axis of the graph represents the size of the population. The blue/thick curve is the exponential growth curve and red/thin curve is logistic growth curve. Hence the correct answer is X-axis is time, Y-axis is population size. Blue/thick curve is the exponential growth and red/thin curve is logistic curve
b.
To give: The formula that describes the blue curve.
Answer to Problem 1CC
Correct answer:
Explanation of Solution
Refer to Fig.1; the blue curve can be described by the formula
c.
To determine: What does the dotted line represents.
Answer to Problem 1CC
Correct answer:
Carrying capacity of the environment (K)
Explanation of Solution
Refer to Fig.1; the dotted line represented on the graph is the carrying capacity of the environment. Hence the correct answer is carrying capacity of the environment (K)
d.
To determine: What does each curve represents.
Answer to Problem 1CC
Correct answer:
Population of logistic curve is most rapid at half of the carrying capacity. Population of exponential growth is most rapid throughout the curve as it is continuously increasing.
Explanation of Solution
Refer to Fig.1; the population growth is most rapid when population attains half of the carrying capacity in logistic curve and the population growth is continuously increasing in the exponential growth curve. Hence the correct answer half of the carrying capacity in logistic curve and continuous growth in exponential growth.
e.
To determine: The curve which represents the global human population.
Answer to Problem 1CC
Correct answer:
Exponential growth curve
Explanation of Solution
Refer to Fig.1; it is the J shaped curve that is continuously increasing is the exponential growth curve. The worldwide population can be represented by this curve as the population is ever increasing. Hence the correct answer is exponential growth curve.
Want to see more full solutions like this?
Chapter 36 Solutions
Campbell Biology: Concepts & Connections (8th Edition)


- Skryf n kortkuns van die Egyptians pyramids vertel ñ story. Maximum 500 woordearrow_forward1.)What cross will result in half homozygous dominant offspring and half heterozygous offspring? 2.) What cross will result in all heterozygous offspring?arrow_forward1.Steroids like testosterone and estrogen are nonpolar and large (~18 carbons). Steroids diffuse through membranes without transporters. Compare and contrast the remaining substances and circle the three substances that can diffuse through a membrane the fastest, without a transporter. Put a square around the other substance that can also diffuse through a membrane (1000x slower but also without a transporter). Molecule Steroid H+ CO₂ Glucose (C6H12O6) H₂O Na+ N₂ Size (Small/Big) Big Nonpolar/Polar/ Nonpolar lonizedarrow_forward
- what are the answer from the bookarrow_forwardwhat is lung cancer why plants removes liquid water intead water vapoursarrow_forward*Example 2: Tracing the path of an autosomal dominant trait Trait: Neurofibromatosis Forms of the trait: The dominant form is neurofibromatosis, caused by the production of an abnormal form of the protein neurofibromin. Affected individuals show spots of abnormal skin pigmentation and non-cancerous tumors that can interfere with the nervous system and cause blindness. Some tumors can convert to a cancerous form. i The recessive form is a normal protein - in other words, no neurofibromatosis.moovi A typical pedigree for a family that carries neurofibromatosis is shown below. Note that carriers are not indicated with half-colored shapes in this chart. Use the letter "N" to indicate the dominant neurofibromatosis allele, and the letter "n" for the normal allele. Nn nn nn 2 nn Nn A 3 N-arrow_forward
- I want to be a super nutrition guy what u guys like recommend mearrow_forwardPlease finish the chart at the bottom. Some of the answers have been filled in.arrow_forward9. Aerobic respiration of one lipid molecule. The lipid is composed of one glycerol molecule connected to two fatty acid tails. One fatty acid is 12 carbons long and the other fatty acid is 18 carbons long in the figure below. Use the information below to determine how much ATP will be produced from the glycerol part of the lipid. Then, in part B, determine how much ATP is produced from the 2 fatty acids of the lipid. Finally put the NADH and ATP yields together from the glycerol and fatty acids (part A and B) to determine your total number of ATP produced per lipid. Assume no other carbon source is available. 18 carbons fatty acids 12 carbons 9 glycerol A. Glycerol is broken down to glyceraldehyde 3-phosphate, a glycolysis intermediate via the following pathway shown in the figure below. Notice this process costs one ATP but generates one FADH2. Continue generating ATP with glyceraldehyde-3-phosphate using the standard pathway and aerobic respiration. glycerol glycerol-3- phosphate…arrow_forward
 Case Studies In Health Information ManagementBiologyISBN:9781337676908Author:SCHNERINGPublisher:Cengage
 Biology (MindTap Course List)BiologyISBN:9781337392938Author:Eldra Solomon, Charles Martin, Diana W. Martin, Linda R. BergPublisher:Cengage Learning
 Concepts of BiologyBiologyISBN:9781938168116Author:Samantha Fowler, Rebecca Roush, James WisePublisher:OpenStax College
 Biology 2eBiologyISBN:9781947172517Author:Matthew Douglas, Jung Choi, Mary Ann ClarkPublisher:OpenStax
 Principles Of Radiographic Imaging: An Art And A ...Health & NutritionISBN:9781337711067Author:Richard R. Carlton, Arlene M. Adler, Vesna BalacPublisher:Cengage Learning