
APPLIED STAT.IN BUS.+ECONOMICS
6th Edition
ISBN: 9781259957598
Author: DOANE
Publisher: RENT MCG
expand_more
expand_more
format_list_bulleted
Videos
Textbook Question
Chapter 3.6, Problem 18SE
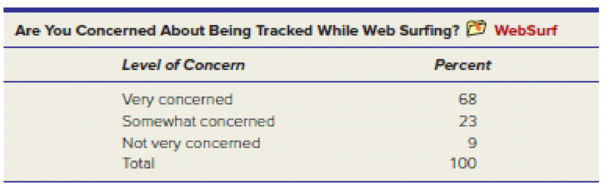
(a) Use Excel to prepare a 2-D pie chart for these web-surfing data. Modify the default colors, fonts, etc., as you judge appropriate to make the display effective. (b) Right-click the chart area, select Chart Type, and change to an exploded 2-D pie chart. (c) Right-click the chart area, select Chart Type, and change to a bar chart. Which do you prefer? Why? Hint: Include data labels with the percent values.
Expert Solution & Answer
Want to see the full answer?
Check out a sample textbook solution
Students have asked these similar questions
Show all work
Show all work
Show all work
Chapter 3 Solutions
APPLIED STAT.IN BUS.+ECONOMICS
Ch. 3.1 - (a) Make a stem-and-leaf plot for these 24...Ch. 3.1 - (a) Make a stem-and-leaf plot for the number of...Ch. 3.1 - (a) Make a stacked dot plot to compare the lengths...Ch. 3.2 - (a) The table shows the number of days on the...Ch. 3.2 - (a) The table shows raw scores on a state civil...Ch. 3.2 - (a) Make a frequency distribution and histogram...Ch. 3.2 - (a) Make a frequency distribution and histogram...Ch. 3.2 - (a) Make a frequency distribution and histogram...Ch. 3.2 - For each frequency distribution, suggest nice...Ch. 3.2 - Below are sorted data showing average spending per...
Ch. 3.4 - (a) Use Excel to prepare a line chart to display...Ch. 3.4 - Prob. 12SECh. 3.4 - Prob. 13SECh. 3.4 - (a) Use Excel to prepare a line chart to display...Ch. 3.5 - Prob. 15SECh. 3.5 - The table shows the number of TVs sold by a major...Ch. 3.6 - (a) Use Excel to prepare a 2-D pie chart for these...Ch. 3.6 - Prob. 19SECh. 3.6 - Prob. 20SECh. 3.7 - (a) Use Excel to make a scatter plot of the data...Ch. 3.7 - Prob. 22SECh. 3.7 - Prob. 23SECh. 3.7 - (a) Use Excel to make a scatter plot of the data,...Ch. 3 - Name two attractive features and two limitations...Ch. 3 - (a) What is a frequency distribution? (b) What are...Ch. 3 - (a) What is a histogram? (b) What does it show?Ch. 3 - (a) What is a bimodal histogram? (b) Explain the...Ch. 3 - (a) What is a scatter plot? (b) What do scatter...Ch. 3 - For what kind of data would we use a bar chart?...Ch. 3 - For what kind of data would we use a line chart?...Ch. 3 - (a) List the three most common types of charts in...Ch. 3 - (a) For what kind of data would we use a pie...Ch. 3 - Which types of charts can be used for time series...Ch. 3 - (a) When might we need a log scale? (b) What do...Ch. 3 - When might we use a stacked column chart? An area...Ch. 3 - List five deceptive graphical techniques.Ch. 3 - What is a pivot table? Why is it useful?Ch. 3 - The durations (minutes) of 26 electric power...Ch. 3 - The U.S. Postal Service will ship a Priority Mail,...Ch. 3 - A study of 40 U.S. cardiac care centers showed the...Ch. 3 - Prob. 28CECh. 3 - An executives telephone log showed the following...Ch. 3 - Below are batting averages of the New York Yankees...Ch. 3 - Prob. 31CECh. 3 - Prob. 32CECh. 3 - Download the full data set from the McGraw-Hill...Ch. 3 - (a) What kind of display is this? (b) Identify its...Ch. 3 - (a) What kind of display is this? (b) Identify its...Ch. 3 - (a) What kind of display is this? (b) Identify its...Ch. 3 - (a) What kind of display is this? (b) Identify its...Ch. 3 - Prob. 38CECh. 3 - (a) What kind of display is this? (b) Identify its...Ch. 3 - (a) What kind of display is this? (b) Identify its...Ch. 3 - Prob. 41CECh. 3 - Prob. 42CECh. 3 - (a) Use Excel to prepare an appropriate type of...Ch. 3 - Prob. 44CECh. 3 - Prob. 45CECh. 3 - (a) Use Excel to prepare an appropriate type of...Ch. 3 - Prob. 47CECh. 3 - (a) Use Excel to prepare an appropriate type of...
Knowledge Booster


Learn more about
Need a deep-dive on the concept behind this application? Look no further. Learn more about this topic, statistics and related others by exploring similar questions and additional content below.Similar questions
- A marketing agency wants to determine whether different advertising platforms generate significantly different levels of customer engagement. The agency measures the average number of daily clicks on ads for three platforms: Social Media, Search Engines, and Email Campaigns. The agency collects data on daily clicks for each platform over a 10-day period and wants to test whether there is a statistically significant difference in the mean number of daily clicks among these platforms. Conduct ANOVA test. You can provide your answer by inserting a text box and the answer must include: also please provide a step by on getting the answers in excel Null hypothesis, Alternative hypothesis, Show answer (output table/summary table), and Conclusion based on the P value.arrow_forwardA company found that the daily sales revenue of its flagship product follows a normal distribution with a mean of $4500 and a standard deviation of $450. The company defines a "high-sales day" that is, any day with sales exceeding $4800. please provide a step by step on how to get the answers Q: What percentage of days can the company expect to have "high-sales days" or sales greater than $4800? Q: What is the sales revenue threshold for the bottom 10% of days? (please note that 10% refers to the probability/area under bell curve towards the lower tail of bell curve) Provide answers in the yellow cellsarrow_forwardBusiness Discussarrow_forward
- The following data represent total ventilation measured in liters of air per minute per square meter of body area for two independent (and randomly chosen) samples. Analyze these data using the appropriate non-parametric hypothesis testarrow_forwardeach column represents before & after measurements on the same individual. Analyze with the appropriate non-parametric hypothesis test for a paired design.arrow_forwardShould you be confident in applying your regression equation to estimate the heart rate of a python at 35°C? Why or why not?arrow_forward
arrow_back_ios
SEE MORE QUESTIONS
arrow_forward_ios
Recommended textbooks for you
 Holt Mcdougal Larson Pre-algebra: Student Edition...AlgebraISBN:9780547587776Author:HOLT MCDOUGALPublisher:HOLT MCDOUGAL
 Elementary AlgebraAlgebraISBN:9780998625713Author:Lynn Marecek, MaryAnne Anthony-SmithPublisher:OpenStax - Rice University
Holt Mcdougal Larson Pre-algebra: Student Edition...
Algebra
ISBN:9780547587776
Author:HOLT MCDOUGAL
Publisher:HOLT MCDOUGAL
Elementary Algebra
Algebra
ISBN:9780998625713
Author:Lynn Marecek, MaryAnne Anthony-Smith
Publisher:OpenStax - Rice University
F- Test or F- statistic (F- Test of Equality of Variance); Author: Prof. Arvind Kumar Sing;https://www.youtube.com/watch?v=PdUt7InTyc8;License: Standard Youtube License
Statistics 101: F-ratio Test for Two Equal Variances; Author: Brandon Foltz;https://www.youtube.com/watch?v=UWQO4gX7-lE;License: Standard YouTube License, CC-BY
Hypothesis Testing and Confidence Intervals (FRM Part 1 – Book 2 – Chapter 5); Author: Analystprep;https://www.youtube.com/watch?v=vth3yZIUlGQ;License: Standard YouTube License, CC-BY
Understanding the Levene's Test for Equality of Variances in SPSS; Author: Dr. Todd Grande;https://www.youtube.com/watch?v=udJr8V2P8Xo;License: Standard Youtube License