
Applied Statistics in Business and Economics
5th Edition
ISBN: 9780077837303
Author: David Doane, Lori Seward Senior Instructor of Operations Management
Publisher: McGraw-Hill Education
expand_more
expand_more
format_list_bulleted
Concept explainers
Videos
Textbook Question
Chapter 3.1, Problem 1SE
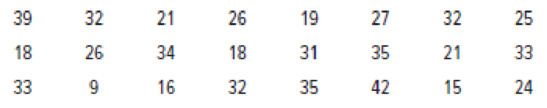
(a) Make a stem-and-leaf plot for these 24 observations on the number of customers who used a down-town CitiBank ATM during the noon hour on 24 consecutive workdays. (b) Make a dot plot of the ATM data (c) Describe these two displays. (Hint: Refer to center, variability, and shape.)
Expert Solution & Answer
Want to see the full answer?
Check out a sample textbook solution
Students have asked these similar questions
Question 21 of 28 (1 point) | Question Attempt: 5 of Unlimited
Dorothy ✔
✓ 12
✓ 13
✓ 14
✓ 15
✓ 16
✓ 17
✓ 18
✓ 19
✓ 20
= 21
22 >
How many apps? According to a website, the mean number of apps on a smartphone in the United States is 82. Assume
the number of apps is normally distributed with mean 82 and standard deviation 30.
Part 1 of 2
(a) What proportion of phones have more than 47 apps? Round the answer to four decimal places.
The proportion of phones that have more than 47 apps is 0.8783
Part: 1/2
Try again
kip Part
ی
E
Recheck
==
==
@
W
D
80
F3
151
E
R
C
レ
Q
FA
975
%
T
B
F5
10
の
000
园
Save For Later
Submit Assignment
© 2025 McGraw Hill LLC. All Rights Reserved. Terms of Use | Privacy Center | Accessibility
Y
V&
U
H
J
N
*
8
M
I
K
O
V
F10
P
=
F11
F12
.
d
You are provided with data that includes all 50 states of the United States. Your task is to draw a sample of:
20 States using Random Sampling (2 points: 1 for random number generation; 1 for random sample)
10 States using Systematic Sampling (4 points: 1 for random numbers generation; 1 for generating random sample different from the previous answer; 1 for correct K value calculation table; 1 for correct sample drawn by using systematic sampling) (For systematic sampling, do not use the original data directly. Instead, first randomize the data, and then use the randomized dataset to draw your sample. Furthermore, do not use the random list previously generated, instead, generate a new random sample for this part. For more details, please see the snapshot provided at the end.) You are provided with data that includes all 50 states of the United States. Your task is to draw a sample of: o 20 States using Random Sampling (2 points: 1 for random number generation; 1 for random sample) o…
Course Home
✓
Do Homework - Practice Ques ✓
My Uploads | bartleby
+
mylab.pearson.com/Student/PlayerHomework.aspx?homeworkId=688589738&questionId=5&flushed=false&cid=8110079¢erwin=yes
Online SP 2025 STA 2023-009 Yin
= Homework: Practice Questions Exam 3
Question list
* Question 3
* Question 4
○ Question 5
K
Concluir atualização:
Ava Pearl 04/02/25 9:28 AM
HW Score: 71.11%, 12.09 of 17 points
○ Points: 0 of 1
Save
Listed in the accompanying table are weights (kg) of randomly selected U.S. Army male personnel measured in 1988 (from "ANSUR I 1988") and different weights (kg) of randomly selected U.S.
Army male personnel measured in 2012 (from "ANSUR II 2012"). Assume that the two samples are independent simple random samples selected from normally distributed populations. Do not
assume that the population standard deviations are equal. Complete parts (a) and (b).
Click the icon to view the ANSUR data.
a. Use a 0.05 significance level to test the claim that the mean weight of the 1988…
Chapter 3 Solutions
Applied Statistics in Business and Economics
Ch. 3.1 - (a) Make a stem-and-leaf plot for these 24...Ch. 3.1 - (a) Make a stem-and-leaf plot for the number of...Ch. 3.1 - Prob. 3SECh. 3.2 - (a) The table shows the number of days on the...Ch. 3.2 - (a) The table shows raw scores on a state civil...Ch. 3.2 - (a) Make a frequency distribution and histogram...Ch. 3.2 - (a) Make a frequency distribution and histogram...Ch. 3.2 - (a) Make a frequency distribution and histogram...Ch. 3.2 - For each frequency distribution, suggest nice...Ch. 3.2 - Below are sorted data showing average spending per...
Ch. 3.4 - (a) Use Excel to prepare a line chart to display...Ch. 3.4 - Prob. 12SECh. 3.4 - Prob. 13SECh. 3.4 - (a) Use Excel to prepare a line chart to display...Ch. 3.5 - Prob. 15SECh. 3.5 - Prob. 16SECh. 3.6 - (a) Use Excel to prepare a 2-D pie chart for these...Ch. 3.6 - Prob. 19SECh. 3.6 - Prob. 20SECh. 3.7 - (a) Use Excel to make a scatter plot of the data...Ch. 3.7 - Prob. 22SECh. 3.7 - Prob. 23SECh. 3.7 - (a) Use Excel to make a scatter plot of the data,...Ch. 3 - Name two attractive features and two limitations...Ch. 3 - (a) What is a frequency distribution? (b) What are...Ch. 3 - (a) What is a histogram? (b) What does it show?Ch. 3 - (a) What is a bimodal histogram? (b) Explain the...Ch. 3 - (a) What is a scatter plot? (b) What do scatter...Ch. 3 - For what kind of data would we use a bar chart?...Ch. 3 - For what kind of data would we use a line chart?...Ch. 3 - (a) List the three most common types of charts in...Ch. 3 - (a) For what kind of data would we use a pie...Ch. 3 - Which types of charts can be used for time series...Ch. 3 - (a) When might we need a log scale? (b) What do...Ch. 3 - When might we use a stacked column chart? An area...Ch. 3 - List five deceptive graphical techniques.Ch. 3 - What is a pivot table? Why is it useful?Ch. 3 - The durations (minutes) of 26 electric power...Ch. 3 - The U.S. Postal Service will ship a Priority Mail,...Ch. 3 - A study of 40 U.S. cardiac care centers showed the...Ch. 3 - Prob. 28CECh. 3 - Prob. 29CECh. 3 - Below are batting averages of the New York Yankees...Ch. 3 - Download the full data set of measurements of...Ch. 3 - Prob. 32CECh. 3 - Download the full data set from the McGraw-Hill...Ch. 3 - (a) What kind of display is this? (b) Identify its...Ch. 3 - (a) What kind of display is this? (b) Identify its...Ch. 3 - Prob. 36CECh. 3 - (a) What kind of display is this? (b) Identify its...Ch. 3 - Prob. 38CECh. 3 - (a) What kind of display is this? (b) Identify its...Ch. 3 - (a) What kind of display is this? (b) Identify its...Ch. 3 - Prob. 41CECh. 3 - Prob. 42CECh. 3 - (a) Use Excel to prepare an appropriate type of...Ch. 3 - Prob. 44CECh. 3 - Prob. 45CECh. 3 - (a) Use Excel to prepare an appropriate type of...Ch. 3 - Prob. 47CECh. 3 - (a) Use Excel to prepare an appropriate type of...
Additional Math Textbook Solutions
Find more solutions based on key concepts
23. A plant nursery sells two sizes of oak trees to landscapers. Large trees cost the nursery $120 from the gro...
College Algebra (Collegiate Math)
Provide an example of a qualitative variable and an example of a quantitative variable.
Elementary Statistics ( 3rd International Edition ) Isbn:9781260092561
The first derivative of function y=25x4.
Calculus for Business, Economics, Life Sciences, and Social Sciences (14th Edition)
Empirical versus Theoretical A Monopoly player claims that the probability of getting a 4 when rolling a six-si...
Introductory Statistics
Use the ideas in drawings a and b to find the solution to Gausss Problem for the sum 1+2+3+...+n. Explain your ...
A Problem Solving Approach To Mathematics For Elementary School Teachers (13th Edition)
1. How is a sample related to a population?
Elementary Statistics: Picturing the World (7th Edition)
Knowledge Booster


Learn more about
Need a deep-dive on the concept behind this application? Look no further. Learn more about this topic, statistics and related others by exploring similar questions and additional content below.Similar questions
- solving problem 1arrow_forwardselect bmw stock. you can assume the price of the stockarrow_forwardThis problem is based on the fundamental option pricing formula for the continuous-time model developed in class, namely the value at time 0 of an option with maturity T and payoff F is given by: We consider the two options below: Fo= -rT = e Eq[F]. 1 A. An option with which you must buy a share of stock at expiration T = 1 for strike price K = So. B. An option with which you must buy a share of stock at expiration T = 1 for strike price K given by T K = T St dt. (Note that both options can have negative payoffs.) We use the continuous-time Black- Scholes model to price these options. Assume that the interest rate on the money market is r. (a) Using the fundamental option pricing formula, find the price of option A. (Hint: use the martingale properties developed in the lectures for the stock price process in order to calculate the expectations.) (b) Using the fundamental option pricing formula, find the price of option B. (c) Assuming the interest rate is very small (r ~0), use Taylor…arrow_forward
- Discuss and explain in the picturearrow_forwardBob and Teresa each collect their own samples to test the same hypothesis. Bob’s p-value turns out to be 0.05, and Teresa’s turns out to be 0.01. Why don’t Bob and Teresa get the same p-values? Who has stronger evidence against the null hypothesis: Bob or Teresa?arrow_forwardReview a classmate's Main Post. 1. State if you agree or disagree with the choices made for additional analysis that can be done beyond the frequency table. 2. Choose a measure of central tendency (mean, median, mode) that you would like to compute with the data beyond the frequency table. Complete either a or b below. a. Explain how that analysis can help you understand the data better. b. If you are currently unable to do that analysis, what do you think you could do to make it possible? If you do not think you can do anything, explain why it is not possible.arrow_forward
- 0|0|0|0 - Consider the time series X₁ and Y₁ = (I – B)² (I – B³)Xt. What transformations were performed on Xt to obtain Yt? seasonal difference of order 2 simple difference of order 5 seasonal difference of order 1 seasonal difference of order 5 simple difference of order 2arrow_forwardCalculate the 90% confidence interval for the population mean difference using the data in the attached image. I need to see where I went wrong.arrow_forwardMicrosoft Excel snapshot for random sampling: Also note the formula used for the last column 02 x✓ fx =INDEX(5852:58551, RANK(C2, $C$2:$C$51)) A B 1 No. States 2 1 ALABAMA Rand No. 0.925957526 3 2 ALASKA 0.372999976 4 3 ARIZONA 0.941323044 5 4 ARKANSAS 0.071266381 Random Sample CALIFORNIA NORTH CAROLINA ARKANSAS WASHINGTON G7 Microsoft Excel snapshot for systematic sampling: xfx INDEX(SD52:50551, F7) A B E F G 1 No. States Rand No. Random Sample population 50 2 1 ALABAMA 0.5296685 NEW HAMPSHIRE sample 10 3 2 ALASKA 0.4493186 OKLAHOMA k 5 4 3 ARIZONA 0.707914 KANSAS 5 4 ARKANSAS 0.4831379 NORTH DAKOTA 6 5 CALIFORNIA 0.7277162 INDIANA Random Sample Sample Name 7 6 COLORADO 0.5865002 MISSISSIPPI 8 7:ONNECTICU 0.7640596 ILLINOIS 9 8 DELAWARE 0.5783029 MISSOURI 525 10 15 INDIANA MARYLAND COLORADOarrow_forward
- Suppose the Internal Revenue Service reported that the mean tax refund for the year 2022 was $3401. Assume the standard deviation is $82.5 and that the amounts refunded follow a normal probability distribution. Solve the following three parts? (For the answer to question 14, 15, and 16, start with making a bell curve. Identify on the bell curve where is mean, X, and area(s) to be determined. 1.What percent of the refunds are more than $3,500? 2. What percent of the refunds are more than $3500 but less than $3579? 3. What percent of the refunds are more than $3325 but less than $3579?arrow_forwardA normal distribution has a mean of 50 and a standard deviation of 4. Solve the following three parts? 1. Compute the probability of a value between 44.0 and 55.0. (The question requires finding probability value between 44 and 55. Solve it in 3 steps. In the first step, use the above formula and x = 44, calculate probability value. In the second step repeat the first step with the only difference that x=55. In the third step, subtract the answer of the first part from the answer of the second part.) 2. Compute the probability of a value greater than 55.0. Use the same formula, x=55 and subtract the answer from 1. 3. Compute the probability of a value between 52.0 and 55.0. (The question requires finding probability value between 52 and 55. Solve it in 3 steps. In the first step, use the above formula and x = 52, calculate probability value. In the second step repeat the first step with the only difference that x=55. In the third step, subtract the answer of the first part from the…arrow_forwardIf a uniform distribution is defined over the interval from 6 to 10, then answer the followings: What is the mean of this uniform distribution? Show that the probability of any value between 6 and 10 is equal to 1.0 Find the probability of a value more than 7. Find the probability of a value between 7 and 9. The closing price of Schnur Sporting Goods Inc. common stock is uniformly distributed between $20 and $30 per share. What is the probability that the stock price will be: More than $27? Less than or equal to $24? The April rainfall in Flagstaff, Arizona, follows a uniform distribution between 0.5 and 3.00 inches. What is the mean amount of rainfall for the month? What is the probability of less than an inch of rain for the month? What is the probability of exactly 1.00 inch of rain? What is the probability of more than 1.50 inches of rain for the month? The best way to solve this problem is begin by a step by step creating a chart. Clearly mark the range, identifying the…arrow_forward
arrow_back_ios
SEE MORE QUESTIONS
arrow_forward_ios
Recommended textbooks for you
 Glencoe Algebra 1, Student Edition, 9780079039897...AlgebraISBN:9780079039897Author:CarterPublisher:McGraw Hill
 Holt Mcdougal Larson Pre-algebra: Student Edition...AlgebraISBN:9780547587776Author:HOLT MCDOUGALPublisher:HOLT MCDOUGAL
 Big Ideas Math A Bridge To Success Algebra 1: Stu...AlgebraISBN:9781680331141Author:HOUGHTON MIFFLIN HARCOURTPublisher:Houghton Mifflin Harcourt
 Trigonometry (MindTap Course List)TrigonometryISBN:9781337278461Author:Ron LarsonPublisher:Cengage Learning
 Functions and Change: A Modeling Approach to Coll...AlgebraISBN:9781337111348Author:Bruce Crauder, Benny Evans, Alan NoellPublisher:Cengage Learning
Glencoe Algebra 1, Student Edition, 9780079039897...
Algebra
ISBN:9780079039897
Author:Carter
Publisher:McGraw Hill
Holt Mcdougal Larson Pre-algebra: Student Edition...
Algebra
ISBN:9780547587776
Author:HOLT MCDOUGAL
Publisher:HOLT MCDOUGAL
Big Ideas Math A Bridge To Success Algebra 1: Stu...
Algebra
ISBN:9781680331141
Author:HOUGHTON MIFFLIN HARCOURT
Publisher:Houghton Mifflin Harcourt
Trigonometry (MindTap Course List)
Trigonometry
ISBN:9781337278461
Author:Ron Larson
Publisher:Cengage Learning
Functions and Change: A Modeling Approach to Coll...
Algebra
ISBN:9781337111348
Author:Bruce Crauder, Benny Evans, Alan Noell
Publisher:Cengage Learning
The Shape of Data: Distributions: Crash Course Statistics #7; Author: CrashCourse;https://www.youtube.com/watch?v=bPFNxD3Yg6U;License: Standard YouTube License, CC-BY
Shape, Center, and Spread - Module 20.2 (Part 1); Author: Mrmathblog;https://www.youtube.com/watch?v=COaid7O_Gag;License: Standard YouTube License, CC-BY
Shape, Center and Spread; Author: Emily Murdock;https://www.youtube.com/watch?v=_YyW0DSCzpM;License: Standard Youtube License