Videos
Least-Squares Regression; Scattergraph; Comparison of Activity Bases [LO 2-4, LO 2-8]
The Hard Rock Mining Company is developing cost formulas for management planning and decision-making purposes. The company’s cost analyst has concluded that utilities cost is a mixed cost, and he is attempting to find a base with which the cost might be closely correlated. The controller has suggested that tons mined might be a good base to use in developing a cost formula. The production superintendent disagrees; she thinks that direct labor-hours would be a better base. The cost analyst has decided to try both bases and has assembled the following information:
![Chapter 2A, Problem 2A.3P, Least-Squares Regression; Scattergraph; Comparison of Activity Bases [LO 2-4, LO 2-8] The Hard Rock](http://dev-ingestion-image-output.s3-website-us-east-1.amazonaws.com/9781259578540/Chapter-2A/images/html_q_78540-2a-2a.3p_1.png)
Required:
- Using tons mined as the independent variable: prepare a scattergraph that plots tons mined on the horizontal axis and utilities cost on the vertical axis. Determine a cost formula for utilities cost using least-squares regression- Express this cost formula in the form
- Using direct labor-hours as the independent variable: prepare a scattergraph that plots direct labor-hours on the horizontal axis and utilities cost on the vertical axis- Determine a cost formula for utilities cost using least-squares regression. Express this cost formula in the form
- Would you recommend that the company use tons mined or direct labor-hours as a base for planning utilities cost?
1.
Concept Introduction:
Scatter-graph:Scatter-graph implies the visual presentation of data on the graph in which costs are shown on the y-axis and activity level is presented in the x-axis.
Least-square regression: Least square regression method use all the available data to derive the best fitting line which would minimize the sum of squared errors between the data points and the regression line.
To prepare:The scatter diagram using tons mixed and utilities cost and determine cost formula
Explanation of Solution
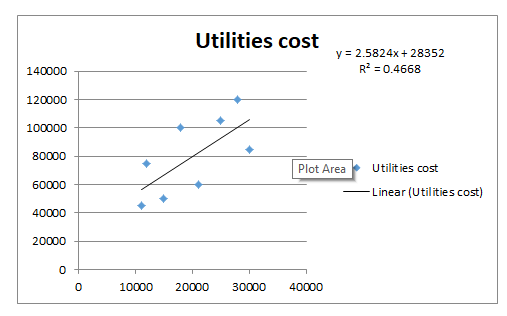
The cost formula is Y=28352+2.58X where, Y is the utilities cost and X is the tons mixed.
Thus, the scatter diagram has been prepared, and least square regression has been performed and cost equation has been determined.
2.
Concept Introduction:
Scatter-graph:Scatter-graph implies the visual presentation of data on the graph in which costs are shown on the y-axis and activity level is presented in the x-axis.
Least-square regression: Least square regression method use all the available data to derive the best fitting line which would minimize the sum of squared errors between the data points and the regression line
To prepare:The scatter diagram using tons mixed and utilities cost and determine cost formula
Explanation of Solution
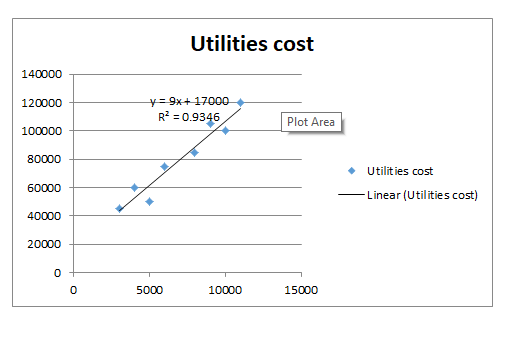
The cost formula is Y=17000+9X where, Y is the utilities cost and X is the direct labor hours Thus, the scatter diagram has been prepared, and least square regression has been performed and cost equation has been determined.
3.
Concept Introduction:
Scatter-graph:Scatter-graph implies the visual presentation of data on the graph in which costs are shown on the y-axis and activity level is presented in the x-axis.
Least-square regression: Least square regression method use all the available data to derive the best fitting line which would minimize the sum of squared errors between the data points and the regression line
The activities to be selected as as a base for planning utilities cost
Answer to Problem 2A.3P
Direct labor hours should be taken as a base for planning utilities costs.
Explanation of Solution
The regression coefficient is 0.9346 when direct labor is taken as base whereas it is 0.4668 when tons mined is taken as base. Regression coefficient determines the accuracy with which the costs can be determined. Thus taking direct labor as base, the costs can be determined with 93.46% accuracy whereas the accuracy percentage is only 46.68% when tons mined are taken as base. Thus, the activity to be taken as a base for planning utilities cost has been determined.
Want to see more full solutions like this?
Chapter 2A Solutions
Managerial Accounting for Managers


- Please provide the solution to this general accounting question with accurate financial calculations.arrow_forwardPlease provide the solution to this general accounting question using proper accounting principles.arrow_forwardCan you solve this general accounting question with the appropriate accounting analysis techniques?arrow_forward
- Dunlop Systems applies manufacturing overhead to products based on standard machine-hours. The budgeted fixed manufacturing overhead cost for the most recent month was $28,800, and the actual fixed manufacturing overhead cost for the month was $29,320. The company based its original budget on 7,200 machine-hours. The standard hours allowed for the actual output of the month totaled 6,800 machine-hours. a. What was the overall fixed manufacturing overhead budget variance for the month? b. What was the fixed overhead rate? c. What was the volume variance?arrow_forwardI need help with this general accounting problem using proper accounting guidelines.arrow_forwardI am looking for the correct answer to this general accounting question with appropriate explanations.arrow_forward
- I need help finding the accurate solution to this general accounting problem with valid methods.arrow_forwardI am looking for the correct answer to this general accounting problem using valid accounting standards.arrow_forwardCan you help me solve this financial accounting question using the correct financial procedures?arrow_forward
 Essentials of Business Analytics (MindTap Course ...StatisticsISBN:9781305627734Author:Jeffrey D. Camm, James J. Cochran, Michael J. Fry, Jeffrey W. Ohlmann, David R. AndersonPublisher:Cengage Learning
 Managerial AccountingAccountingISBN:9781337912020Author:Carl Warren, Ph.d. Cma William B. TaylerPublisher:South-Western College Pub
 Cornerstones of Cost Management (Cornerstones Ser...AccountingISBN:9781305970663Author:Don R. Hansen, Maryanne M. MowenPublisher:Cengage Learning