Concept explainers
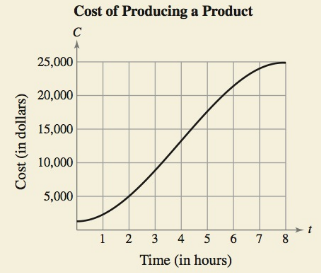
HOW DO YOU SEE IT? The cost C (In dollars) of producing x units of a product is C = 60x + 1350. For one week, management determined that the number of units produced x at the end of t hours was

Using the graph, which is greater, the rate of change of the cost after 1 hour or the rate of change of the cost after 4 hours?
Explain why the cost function is not increasing at a constant rate during the eight-hour shift.
Want to see the full answer?
Check out a sample textbook solution
Chapter 2 Solutions
EBK CALCULUS: AN APPLIED APPROACH
- Flood Control A river is 8 feet above its flood stage. The water is receding at a rate of 3 inches per hour. Write a mathematical model that shows the number of feet above flood stage after t hours. Assuming the water continually recedes at this rate, when will the river be 1 foot above its flood stage?arrow_forwardbThe average rate of change of the linear function f(x)=3x+5 between any two points is ________.arrow_forwardWhat is true of the appearance of graphs thatre?ect a direct variation between two variables?arrow_forward
- The half-life of plutonium-244 is 80,000,000 years. Find function gives the amount of carbon-14 remaining as a function of time, measured in years.arrow_forwardExplain how to interpret the initial value in a word problem that uses a linear function.arrow_forwardThe weekly profit P for a widget producer is a function of the number n of widgets sold. The formula is as follows, where P is measured in thousands of dollars, n is measured in thousands of widgets, and the formula is valid up to a level of 12 thousand widgets sold. P = −1 + 2.6n − 0.2n2 Exercise (a) Make a graph of P versus n. Step 1 Because the formula is valid for up to 12 thousand widgets sold, we make the graph using a horizontal span of 0 to . The table of values below led us to choose a vertical span of -2 to 8. The graph is on below. The horizontal axis corresponds to the variable which is thousands of widgets sold, and the vertical axis corresponds to the variable which is weekly profit measured in thousands of dollars. n P 0 -1.00 3.25 5.34 6.50 7.45 9.25 5.94 12.00 1.40 Select the correct graph. Exercise (b) Calculate P(0) and explain in practical terms what your answer means. Exercise (c)…arrow_forward
- Q3arrow_forward= 373x – 0.9x2. (Round your answer to the nearest cent.) Find the maximum revenue for the revenue function R(x) R = $arrow_forwardTotal Cost (in dollars) %S4 8.EE.2.6 Carlos bought a new cell phone. The graph represents the relationship between the number of minutes he uses and the total cost. What is the equation of the line? 25 20 15 10 0 20 40 60 80 100 120 140 160 180 200 Number of Minutes A) y= 5x+ 0.1 B) y = 0.1x + 5 C) y=0.5x + 5 D) y= 5x+ 5 ner item sold.arrow_forward

 Glencoe Algebra 1, Student Edition, 9780079039897...AlgebraISBN:9780079039897Author:CarterPublisher:McGraw Hill
 Algebra and Trigonometry (MindTap Course List)AlgebraISBN:9781305071742Author:James Stewart, Lothar Redlin, Saleem WatsonPublisher:Cengage LearningAlgebra & Trigonometry with Analytic GeometryAlgebraISBN:9781133382119Author:SwokowskiPublisher:Cengage


