
Elementary Statistics Plus MyLab Statistics with Pearson eText -- Access Card Package (7th Edition) (What's New in Statistics)
7th Edition
ISBN: 9780134684901
Author: Ron Larson, Betsy Farber
Publisher: PEARSON
expand_more
expand_more
format_list_bulleted
Concept explainers
Videos
Textbook Question
Chapter 2.3, Problem 26E
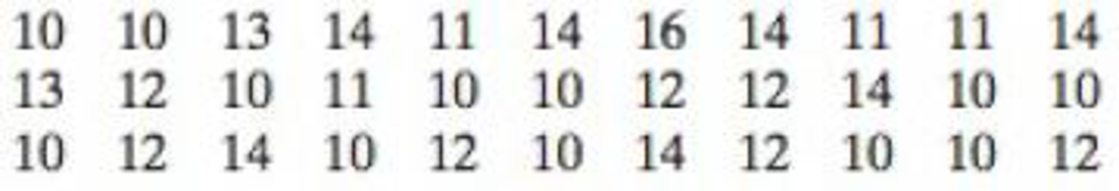
Finding and Discussing the Mean,
26. Number One Songs The numbers of weeks the 33 longest leading Hot 100 songs remained at number 1 as of November 19, 2016 (Source: Billboard)
Expert Solution & Answer
Want to see the full answer?
Check out a sample textbook solution
Students have asked these similar questions
«
CENGAGE MINDTAP
Quiz: Chapter 38
Assignment: Quiz: Chapter 38
ips
Questions ra1kw08h_ch38.15m
13.
14.
15.
O
Which sentence has modifiers in the correct place?
O a. When called, she for a medical emergency responds quickly.
b. Without giving away too much of the plot, Helena described the heroine's actions in the film.
O c. Nearly the snakebite victim died before the proper antitoxin was injected.
. O
O
16
16.
O
17.
18.
O
19.
O
20
20.
21
21.
22.
22
DS
23.
23
24.
25.
O
O
O
Questions ra1kw08h_ch36.14m
12.
13.
14.
15.
16.
Ӧ
17.
18.
19.
OS
20.
Two separate sentences need
Oa. two separate subjects.
Ob. two dependent clauses.
c. one shared subject.
Customers experiencing technical difficulty with their Internet cable service may call an 800 number for technical support. It takes the technician between 30 seconds and 11 minutes to resolve the problem. The distribution of this support time follows the uniform distribution.
Required:
a. What are the values for a and b in minutes?
Note: Do not round your intermediate calculations. Round your answers to 1 decimal place.
b-1. What is the mean time to resolve the problem?
b-2. What is the standard deviation of the time?
c. What percent of the problems take more than 5 minutes to resolve?
d. Suppose we wish to find the middle 50% of the problem-solving times. What are the end points of these two times?
Chapter 2 Solutions
Elementary Statistics Plus MyLab Statistics with Pearson eText -- Access Card Package (7th Edition) (What's New in Statistics)
Ch. 2.1 - Construct a frequency distribution using the...Ch. 2.1 - Using the frequency distribution constructed in...Ch. 2.1 - Use the frequency distribution from Try It...Ch. 2.1 - Use the frequency distribution from Try It...Ch. 2.1 - Use the frequency distribution in Try It Yourself...Ch. 2.1 - Use the frequency distribution from Try It...Ch. 2.1 - Use technology and the frequency distribution from...Ch. 2.1 - What are some benefits of representing data sets...Ch. 2.1 - Why should the number of classes in a frequency...Ch. 2.1 - What is the difference between class limits and...
Ch. 2.1 - What is the difference between relative frequency...Ch. 2.1 - After constructing an expanded frequency...Ch. 2.1 - What is the difference between a frequency polygon...Ch. 2.1 - True or False? In Exercises 710, determine whether...Ch. 2.1 - True or False? In Exercises 710, determine whether...Ch. 2.1 - True or False? In Exercises 710, determine whether...Ch. 2.1 - Prob. 10ECh. 2.1 - In Exercises 1114, use the minimum and maximum...Ch. 2.1 - In Exercises 1114, use the minimum and maximum...Ch. 2.1 - In Exercises 1114, use the minimum and maximum...Ch. 2.1 - In Exercises 1114, use the minimum and maximum...Ch. 2.1 - Reading a Frequency Distribution In Exercises 15...Ch. 2.1 - Reading a Frequency Distribution In Exercises 15...Ch. 2.1 - Use the frequency distribution in Exercise 15 to...Ch. 2.1 - Use the frequency distribution in Exercise 16 to...Ch. 2.1 - Graphical Analysis In Exercises 19 and 20, use the...Ch. 2.1 - Graphical Analysis In Exercises 19 and 20, use the...Ch. 2.1 - Graphical Analysis In Exercises 21 and 22, use the...Ch. 2.1 - Graphical Analysis In Exercises 21 and 22, use the...Ch. 2.1 - Graphical Analysis In Exercises 23 and 24, use the...Ch. 2.1 - Graphical Analysis In Exercises 23 and 24, use the...Ch. 2.1 - Prob. 25ECh. 2.1 - Graphical Analysis In Exercises 25 and 26, use the...Ch. 2.1 - Use the ogive in Exercise 25 to approximate (a)...Ch. 2.1 - Use the ogive in Exercise 26 to approximate (a)...Ch. 2.1 - Constructing a Frequency Distribution In Exercises...Ch. 2.1 - Constructing a Frequency Distribution In Exercises...Ch. 2.1 - Constructing a Frequency Distribution and a...Ch. 2.1 - Constructing a Frequency Distribution and a...Ch. 2.1 - Constructing a Frequency Distribution and a...Ch. 2.1 - Constructing a Frequency Distribution and a...Ch. 2.1 - Constructing a Frequency Distribution and a...Ch. 2.1 - Constructing a Frequency Distribution and a...Ch. 2.1 - Constructing a Frequency Distribution and a...Ch. 2.1 - Constructing a Frequency Distribution and a...Ch. 2.1 - Constructing a Frequency Distribution and a...Ch. 2.1 - Constructing a Frequency Distribution and a...Ch. 2.1 - Constructing a Cumulative Frequency Distribution...Ch. 2.1 - Constructing a Cumulative Frequency Distribution...Ch. 2.1 - In Exercises 43 and 44, use the data set and the...Ch. 2.1 - In Exercises 43 and 44, use the data set and the...Ch. 2.1 - What Would You Do? You work at a bank and are...Ch. 2.1 - What Would You Do? The admissions department for a...Ch. 2.1 - Writing Use the data set listed and technology to...Ch. 2.2 - Use a stem-and-leaf plot to organize the points...Ch. 2.2 - Using two rows for each stem, revise the...Ch. 2.2 - Use a dot plot to organize the points scored by...Ch. 2.2 - The numbers of earned degrees conferred (in...Ch. 2.2 - Every year, the Better Business Bureau (BBB)...Ch. 2.2 - The lengths of employment and the salaries of 10...Ch. 2.2 - Use the table in Example 7 to construct a time...Ch. 2.2 - Name some ways to display quantitative data...Ch. 2.2 - What is an advantage of using a stem-and-leaf plot...Ch. 2.2 - In terms of displaying data, how is a...Ch. 2.2 - How is a Pareto chart different from a standard...Ch. 2.2 - Putting Graphs in Context In Exercises 58, match...Ch. 2.2 - Putting Graphs in Context In Exercises 58, match...Ch. 2.2 - Putting Graphs in Context In Exercises 58, match...Ch. 2.2 - Putting Graphs in Context In Exercises 58, match...Ch. 2.2 - Graphical Analysis In Exercises 912, use the...Ch. 2.2 - Graphical Analysis In Exercises 912, use the...Ch. 2.2 - Graphical Analysis In Exercises 912, use the...Ch. 2.2 - Prob. 12ECh. 2.2 - Graphical Analysis In Exercises 1316, give three...Ch. 2.2 - Graphical Analysis In Exercises 1316, give three...Ch. 2.2 - Graphical Analysis In Exercises 1316, give three...Ch. 2.2 - Graphical Analysis In Exercises 1316, give three...Ch. 2.2 - Graphing Data Sets In Exercises 1732, organize the...Ch. 2.2 - Graphing Data Sets In Exercises 1732, organize the...Ch. 2.2 - Prob. 19ECh. 2.2 - Graphing Data Sets In Exercises 1732, organize the...Ch. 2.2 - Graphing Data Sets In Exercises 1732, organize the...Ch. 2.2 - Graphing Data Sets In Exercises 1732, organize the...Ch. 2.2 - Graphing Data Sets In Exercises 1732, organize the...Ch. 2.2 - Graphing Data Sets In Exercises 1732, organize the...Ch. 2.2 - Graphing Data Sets In Exercises 1732, organize the...Ch. 2.2 - Graphing Data Sets In Exercises 1732, organize the...Ch. 2.2 - Graphing Data Sets In Exercises 1732, organize the...Ch. 2.2 - Graphing Data Sets In Exercises 1732, organize the...Ch. 2.2 - Hourly Wages Use a scatter plot to display the...Ch. 2.2 - Salaries Use a scatter plot to display the data...Ch. 2.2 - Engineering Degrees Use a time series chart to...Ch. 2.2 - Construction Use a time series chart to display...Ch. 2.2 - Basketball Display the data below in a...Ch. 2.2 - Phone Screen Sizes Display the data below in a dot...Ch. 2.2 - Favorite Season Display the data below in a Pareto...Ch. 2.2 - Favorite Day of the Week Display the data below in...Ch. 2.2 - A Misleading Graph? A misleading graph is not...Ch. 2.2 - Prob. 38ECh. 2.2 - A Misleading Graph? A misleading graph is not...Ch. 2.2 - Prob. 40ECh. 2.2 - Law Firm Salaries A back-to-back stem-and-leaf...Ch. 2.2 - Yoga Classes The data sets at the left show the...Ch. 2.2 - Choosing an Appropriate Display Use technology to...Ch. 2.3 - Find the mean of the points scored by the 51...Ch. 2.3 - Find the median of the points scored by the 51...Ch. 2.3 - The points scored by the winning teams in the...Ch. 2.3 - Find the mode of the points scored by the 51...Ch. 2.3 - In a survey, 1534 adults were asked, How much do...Ch. 2.3 - Remove the data entry 65 from the data set in...Ch. 2.3 - In Example 7, your grade in the two-credit course...Ch. 2.3 - Use a frequency distribution to estimate the mean...Ch. 2.3 - True or False? In Exercises 14, determine whether...Ch. 2.3 - True or False? In Exercises 14, determine whether...Ch. 2.3 - True or False? In Exercises 14, determine whether...Ch. 2.3 - True or False? In Exercises 14, determine whether...Ch. 2.3 - Constructing Data Sets In Exercises 58, construct...Ch. 2.3 - Constructing Data Sets In Exercises 58, construct...Ch. 2.3 - Mean is not representative of a typical number in...Ch. 2.3 - Prob. 8ECh. 2.3 - Graphical Analysis In Exercises 912, determine...Ch. 2.3 - Graphical Analysis In Exercises 912, determine...Ch. 2.3 - Graphical Analysis In Exercises 912, determine...Ch. 2.3 - Graphical Analysis In Exercises 912, determine...Ch. 2.3 - Graphical Analysis In Exercises 912, determine...Ch. 2.3 - Graphical Analysis In Exercises 912, determine...Ch. 2.3 - Graphical Analysis In Exercises 912, determine...Ch. 2.3 - Graphical Analysis In Exercises 912, determine...Ch. 2.3 - Finding and Discussing the Mean, Median, and Mode...Ch. 2.3 - Finding and Discussing the Mean, Median, and Mode...Ch. 2.3 - Finding and Discussing the Mean, Median, and Mode...Ch. 2.3 - Finding and Discussing the Mean, Median, and Mode...Ch. 2.3 - Finding and Discussing the Mean, Median, and Mode...Ch. 2.3 - Finding and Discussing the Mean, Median, and Mode...Ch. 2.3 - Finding and Discussing the Mean, Median, and Mode...Ch. 2.3 - Finding and Discussing the Mean, Median, and Mode...Ch. 2.3 - Prob. 25ECh. 2.3 - Finding and Discussing the Mean, Median, and Mode...Ch. 2.3 - Finding and Discussing the Mean, Median, and Mode...Ch. 2.3 - Prob. 28ECh. 2.3 - Finding and Discussing the Mean, Median, and Mode...Ch. 2.3 - Finding and Discussing the Mean, Median, and Mode...Ch. 2.3 - Finding and Discussing the Mean, Median, and Mode...Ch. 2.3 - Finding and Discussing the Mean, Median, and Mode...Ch. 2.3 - Finding and Discussing the Mean, Median, and Mode...Ch. 2.3 - Finding and Discussing the Mean, Median, and Mode...Ch. 2.3 - Graphical Analysis In Exercises 35 and 36,...Ch. 2.3 - Graphical Analysis In Exercises 35 and 36,...Ch. 2.3 - In Exercises 3740, without performing any...Ch. 2.3 - In Exercises 3740, without performing any...Ch. 2.3 - In Exercises 3740, without performing any...Ch. 2.3 - In Exercises 3740, without performing any...Ch. 2.3 - Finding a Weighted Mean In Exercises 4146, find...Ch. 2.3 - Finding a Weighted Mean In Exercises 4146, find...Ch. 2.3 - Finding a Weighted Mean In Exercises 4146, find...Ch. 2.3 - Finding a Weighted Mean In Exercises 4146, find...Ch. 2.3 - Finding a Weighted Mean In Exercises 4146, find...Ch. 2.3 - Finding a Weighted Mean In Exercises 4146, find...Ch. 2.3 - Finding a Weighted Mean In Exercises 4146, find...Ch. 2.3 - Finding a Weighted Mean In Exercises 4146, find...Ch. 2.3 - Finding the Mean of a Frequency Distribution In...Ch. 2.3 - Finding the Mean of a Frequency Distribution In...Ch. 2.3 - Finding the Mean of a Frequency Distribution In...Ch. 2.3 - Finding the Mean of a Frequency Distribution In...Ch. 2.3 - Identifying the Shape of a Distribution In...Ch. 2.3 - Identifying the Shape of a Distribution In...Ch. 2.3 - Identifying the Shape of a Distribution In...Ch. 2.3 - Identifying the Shape of a Distribution In...Ch. 2.3 - Protein Powder During a quality assurance check,...Ch. 2.3 - U.S. Trade Deficits The table at the left shows...Ch. 2.3 - Graphical Analysis In Exercises 59 and 60, the...Ch. 2.3 - Graphical Analysis In Exercises 59 and 60, the...Ch. 2.3 - Prob. 61ECh. 2.3 - Prob. 62ECh. 2.3 - Prob. 63ECh. 2.3 - Prob. 64ECh. 2.3 - Data Analysis Students in an experimental...Ch. 2.3 - Trimmed Mean To find the 10% trimmed mean of a...Ch. 2.3 - Specify the lower limit to be 1 and the upper...Ch. 2.3 - Specify the lower limit to be 0 and the upper...Ch. 2.4 - Find the range of the starting salaries for...Ch. 2.4 - Find the population variance and standard...Ch. 2.4 - Refer to the study in Example 3. The recovery...Ch. 2.4 - Sample office rental rates (in dollars per square...Ch. 2.4 - Write a data set that has 10 entries, a mean of...Ch. 2.4 - Estimate the percent of women ages 2029 whose...Ch. 2.4 - Apply Chebychevs Theorem to the data for Iowa...Ch. 2.4 - Change three of the 6s in the data set to 4s. How...Ch. 2.4 - In the frequency distribution in Example 9, 599.5...Ch. 2.4 - Find the coefficient of variation for the office...Ch. 2.4 - Explain how to find the range of a data set. What...Ch. 2.4 - Explain how to find the deviation of an entry in a...Ch. 2.4 - Why is the standard deviation used more frequently...Ch. 2.4 - Explain the relationship between variance and...Ch. 2.4 - Describe the difference between the calculation of...Ch. 2.4 - Given a data set. how do you know whether to...Ch. 2.4 - Discuss the similarities and the differences...Ch. 2.4 - What must you know about a data set before you can...Ch. 2.4 - Finding the Range of a Data Set In Exercises 9 and...Ch. 2.4 - Finding the Range of a Data Set In Exercises 9 and...Ch. 2.4 - Archaeology The depths (in inches) at which 10...Ch. 2.4 - In Exercise 11, compare your answer to part (a)...Ch. 2.4 - Finding Population Statistics In Exercises 13 and...Ch. 2.4 - Finding Population Statistics In Exercises 13 and...Ch. 2.4 - Finding Sample Statistics In Exercises 15 and 16,...Ch. 2.4 - Finding Sample Statistics In Exercises 15 and 16,...Ch. 2.4 - Estimating Standard Deviation Both data sets shown...Ch. 2.4 - Estimating Standard Deviation Both data sets shown...Ch. 2.4 - Salary Offers You are applying for jobs at two...Ch. 2.4 - Prob. 20ECh. 2.4 - Graphical Analysis In Exercises 2124, you are...Ch. 2.4 - Graphical Analysis In Exercises 2124, you are...Ch. 2.4 - Graphical Analysis In Exercises 2124, you are...Ch. 2.4 - Graphical Analysis In Exercises 2124, you are...Ch. 2.4 - Constructing Data Sets In Exercises 2528,...Ch. 2.4 - Constructing Data Sets In Exercises 2528,...Ch. 2.4 - Constructing Data Sets In Exercises 2528,...Ch. 2.4 - Constructing Data Sets In Exercises 2528,...Ch. 2.4 - Using the Empirical Rule In Exercises 2934, use...Ch. 2.4 - Using the Empirical Rule In Exercises 2934, use...Ch. 2.4 - Using the Empirical Rule In Exercises 2934, use...Ch. 2.4 - Using the Empirical Rule In Exercises 2934, use...Ch. 2.4 - Using the Empirical Rule In Exercises 2934, use...Ch. 2.4 - Using the Empirical Rule In Exercises 2934, use...Ch. 2.4 - Using Chebychevs Theorem You are conducting a...Ch. 2.4 - Using Chebychevs Theorem Old Faithful is a famous...Ch. 2.4 - Using Chebychevs Theorem The mean score on a...Ch. 2.4 - Using Chebychevs Theorem The mean number of runs...Ch. 2.4 - Finding the Sample Mean and Standard Deviation for...Ch. 2.4 - Finding the Sample Mean and Standard Deviation for...Ch. 2.4 - Estimating the Sample Mean and Standard Deviation...Ch. 2.4 - Estimating the Sample Mean and Standard Deviation...Ch. 2.4 - Estimating the Sample Mean and Standard Deviation...Ch. 2.4 - Estimating the Sample Mean and Standard Deviation...Ch. 2.4 - Comparing Variation in Different Data Sets In...Ch. 2.4 - Comparing Variation in Different Data Sets In...Ch. 2.4 - Comparing Variation in Different Data Sets In...Ch. 2.4 - Comparing Variation in Different Data Sets In...Ch. 2.4 - Comparing Variation in Different Data Sets In...Ch. 2.4 - Comparing Variation in Different Data Sets In...Ch. 2.4 - Alternative Formula You used SSx=(xx)2 when...Ch. 2.4 - Mean Absolute Deviation Another useful measure of...Ch. 2.4 - Scaling Data Sample annual salaries (in thousands...Ch. 2.4 - Shifting Data Sample annual salaries (in thousands...Ch. 2.4 - Pearsons Index of Skewness The English...Ch. 2.4 - Prob. 56ECh. 2.4 - Specify the lower limit to be 10 and the upper...Ch. 2.4 - Specify the lower limit to be 30 and the upper...Ch. 2.4 - Employees Which state has the greatest number of...Ch. 2.4 - Mean Business Size Estimate the mean number of...Ch. 2.4 - Employees Which state has the greatest number of...Ch. 2.4 - Standard Deviation Estimate the standard deviation...Ch. 2.4 - Standard Deviation Which state has the greatest...Ch. 2.4 - Distribution Describe the distribution of the...Ch. 2.5 - Find the first, second, and third quartiles for...Ch. 2.5 - The tuition costs (in thousands of dollars) for 25...Ch. 2.5 - Find the interquartile range for the points scored...Ch. 2.5 - Draw a box-and-whisker plot that represents the...Ch. 2.5 - The points scored by the 51 winning teams in the...Ch. 2.5 - For the data set in Try It Yourself 2, find the...Ch. 2.5 - The monthly utility bills in a city have a mean of...Ch. 2.5 - Use the information in Example 8 to compare the...Ch. 2.5 - The length of a guest lecturers talk represents...Ch. 2.5 - A motorcycles fuel efficiency represents the ninth...Ch. 2.5 - A students score on the Fundamentals of...Ch. 2.5 - A students IQ score is in the 91st percentile on...Ch. 2.5 - Explain how to identify outliers using the...Ch. 2.5 - Describe the relationship between quartiles and...Ch. 2.5 - True or False? In Exercises 710, determine whether...Ch. 2.5 - True or False? In Exercises 710, determine whether...Ch. 2.5 - True or False? In Exercises 710, determine whether...Ch. 2.5 - True or False? In Exercises 710, determine whether...Ch. 2.5 - Finding Quartiles, Interquartile Range, and...Ch. 2.5 - Finding Quartiles, Interquartile Range, and...Ch. 2.5 - Graphical Analysis In Exercises 13 and 14, use the...Ch. 2.5 - Graphical Analysis In Exercises 13 and 14, use the...Ch. 2.5 - Drawing a Box-and-Whisker Plot In Exercises 1518,...Ch. 2.5 - Drawing a Box-and-Whisker Plot In Exercises 1518,...Ch. 2.5 - Drawing a Box-and-Whisker Plot In Exercises 1518,...Ch. 2.5 - Drawing a Box-and-Whisker Plot In Exercises 1518,...Ch. 2.5 - Graphical Analysis In Exercises 1922, use the...Ch. 2.5 - Graphical Analysis In Exercises 1922, use the...Ch. 2.5 - Graphical Analysis In Exercises 1922, use the...Ch. 2.5 - Graphical Analysis In Exercises 1922, use the...Ch. 2.5 - Prob. 23ECh. 2.5 - Using Technology to Find Quartiles and Draw Graphs...Ch. 2.5 - Using Technology to Find Quartiles and Draw Graphs...Ch. 2.5 - Using Technology to Find Quartiles and Draw Graphs...Ch. 2.5 - Studying Refer to the data set in Exercise 23 and...Ch. 2.5 - Hourly Earnings Refer to the data set in Exercise...Ch. 2.5 - Interpreting Percentiles In Exercises 2932, use...Ch. 2.5 - Interpreting Percentiles In Exercises 2932, use...Ch. 2.5 - Interpreting Percentiles In Exercises 2932, use...Ch. 2.5 - Interpreting Percentiles In Exercises 2932, use...Ch. 2.5 - Finding a Percentile In Exercises 3336, use the...Ch. 2.5 - Finding a Percentile In Exercises 3336, use the...Ch. 2.5 - Finding a Percentile In Exercises 3336, use the...Ch. 2.5 - Finding a Percentile In Exercises 3336, use the...Ch. 2.5 - Finding and Interpreting Percentiles In Exercises...Ch. 2.5 - Finding and Interpreting Percentiles In Exercises...Ch. 2.5 - Finding and Interpreting Percentiles In Exercises...Ch. 2.5 - Which wait times are between the 25th and 75th...Ch. 2.5 - Graphical Analysis In Exercises 41 and 42, the...Ch. 2.5 - Graphical Analysis In Exercises 41 and 42, the...Ch. 2.5 - Finding z-Scores The distribution of the ages of...Ch. 2.5 - Finding z-Scores The distribution of the ages of...Ch. 2.5 - Finding z-Scores The distribution of the ages of...Ch. 2.5 - Finding z-Scores The distribution of the ages of...Ch. 2.5 - Finding z-Scores The distribution of the ages of...Ch. 2.5 - Prob. 48ECh. 2.5 - Life Spans of Tires A brand of automobile tire has...Ch. 2.5 - Life Spans of Fruit Flies The life spans of a...Ch. 2.5 - Comparing z-Scores from Different Data Sets The...Ch. 2.5 - Comparing z-Scores from Different Data Sets The...Ch. 2.5 - Comparing z-Scores from Different Data Sets The...Ch. 2.5 - Comparing z-Scores from Different Data Sets The...Ch. 2.5 - Prob. 55ECh. 2.5 - Prob. 56ECh. 2.5 - Song Lengths Side-by-side box-and-whisker plots...Ch. 2.5 - Credit Card Purchases The credit card purchases...Ch. 2.5 - Modified Box-and-Whisker Plot In Exercises 5962,...Ch. 2.5 - Modified Box-and-Whisker Plot In Exercises 5962,...Ch. 2.5 - Modified Box-and-Whisker Plot In Exercises 5962,...Ch. 2.5 - Modified Box-and-Whisker Plot In Exercises 5962,...Ch. 2 - In Exercises 1 and 2, use the data set, which...Ch. 2 - In Exercises 1 and 2, use the data set, which...Ch. 2 - In Exercises 3 and 4, use the data set shown in...Ch. 2 - In Exercises 3 and 4, use the data set shown in...Ch. 2 - In Exercises 5 and 6, use the data set, which...Ch. 2 - In Exercises 5 and 6, use the data set, which...Ch. 2 - In Exercises 7 and 8, use the data set, which...Ch. 2 - In Exercises 7 and 8, use the data set, which...Ch. 2 - In Exercises 9 and 10, use the data set, which...Ch. 2 - In Exercises 9 and 10, use the data set, which...Ch. 2 - The heights (in feet) and the numbers of stories...Ch. 2 - The U.S. real unemployment rates over a 12-year...Ch. 2 - In Exercises 13 and 14, find the mean, the median,...Ch. 2 - In Exercises 13 and 14, find the mean, the median,...Ch. 2 - For the six test scores 78, 72, 86, 91, 87, and...Ch. 2 - For the four test scores 96, 85, 91, and 86, the...Ch. 2 - Estimate the mean of the frequency distribution...Ch. 2 - The frequency distribution shows the numbers of...Ch. 2 - Describe the shape of the distribution for the...Ch. 2 - Describe the shape of the distribution for the...Ch. 2 - In Exercises 21 and 22, determine whether the...Ch. 2 - In Exercises 21 and 22, determine whether the...Ch. 2 - For the histogram in Exercise 21, which is...Ch. 2 - Prob. 2.3.24RECh. 2 - In Exercises 25 and 26, find the range, mean,...Ch. 2 - In Exercises 25 and 26, find the range, mean,...Ch. 2 - In Exercises 27 and 28, find the range, mean,...Ch. 2 - In Exercises 27 and 28, find the range, mean,...Ch. 2 - The mean charge for electricity for a sample of...Ch. 2 - The mean charge for satellite television for a...Ch. 2 - The mean sale per customer for 40 customers at a...Ch. 2 - The mean duration of the 135 space shuttle flights...Ch. 2 - From a random sample of households, the numbers of...Ch. 2 - From a random sample of airplanes, the numbers of...Ch. 2 - In Exercises 35 and 36, find the coefficient of...Ch. 2 - In Exercises 35 and 36, find the coefficient of...Ch. 2 - In Exercises 3740, use the data set, which...Ch. 2 - In Exercises 3740, use the data set, which...Ch. 2 - In Exercises 3740, use the data set, which...Ch. 2 - In Exercises 3740, use the data set, which...Ch. 2 - Find the interquartile range of the data set from...Ch. 2 - The weights (in pounds) of the defensive players...Ch. 2 - A students test grade of 75 represents the 65th...Ch. 2 - As of December 2016, there were 721 adult...Ch. 2 - The towing capacities (in pounds) of all the...Ch. 2 - The towing capacities (in pounds) of all the...Ch. 2 - The towing capacities (in pounds) of all the...Ch. 2 - The towing capacities (in pounds) of all the...Ch. 2 - The data set represents the numbers of minutes a...Ch. 2 - Use frequency distribution formulas to approximate...Ch. 2 - Prob. 3CQCh. 2 - Prob. 4CQCh. 2 - The mean price of new homes from a sample of...Ch. 2 - Prob. 6CQCh. 2 - Prob. 7CQCh. 2 - The overall averages of 12 students in a...Ch. 2 - The data set represents the numbers of movies that...Ch. 2 - Use frequency distribution formulas to estimate...Ch. 2 - For the data set in Exercise 2, find the...Ch. 2 - The table lists the numbers of albums by The...Ch. 2 - The numbers of minutes it took 12 students in a...Ch. 2 - The data set represents the ages of 15 college...Ch. 2 - The mean gestational length of a sample of 208...Ch. 2 - How Would You Do It? (a) How would you investigate...Ch. 2 - Displaying the Data (a) What type of graph would...Ch. 2 - Measuring the Data (a) What other statistical...Ch. 2 - In Exercises 15, use technology. If possible,...Ch. 2 - In Exercises 15, use technology. If possible,...Ch. 2 - In Exercises 15, use technology. If possible,...Ch. 2 - In Exercises 15, use technology. If possible,...Ch. 2 - In Exercises 15, use technology. If possible,...Ch. 2 - What percent of the distribution lies within one...Ch. 2 - Do the results of Exercise 6 agree with the...Ch. 2 - Do the results of Exercise 6 agree with Chebychevs...Ch. 2 - Use the frequency distribution in Exercise 4 to...Ch. 2 - Prob. 10TCh. 2 - In Exercices 1 and 2, identify the sampling...Ch. 2 - Prob. 2CRCh. 2 - Prob. 3CRCh. 2 - In Exercises 4 and 5, determine whether the number...Ch. 2 - In Exercises 4 and 5, determine whether the number...Ch. 2 - Prob. 6CRCh. 2 - In Exercises 7 and 8, identify the population and...Ch. 2 - Prob. 8CRCh. 2 - In Exercises 9 and 10, determine whether the study...Ch. 2 - Section 1.3 In Exercises 9 and 10, determine...Ch. 2 - Prob. 11CRCh. 2 - Section 1.2 In Exercises 11 and 12, determine...Ch. 2 - The numbers of tornadoes by state in 2016 are...Ch. 2 - Prob. 14CRCh. 2 - Tail lengths (in feet) for a sample of American...Ch. 2 - A study shows that life expectancies for Americans...Ch. 2 - In Exercises 1719, use the data set, which...Ch. 2 - In Exercises 1719, use the data set, which...Ch. 2 - In Exercises 1719, use the data set, which...
Knowledge Booster


Learn more about
Need a deep-dive on the concept behind this application? Look no further. Learn more about this topic, statistics and related others by exploring similar questions and additional content below.Similar questions
- Exercise 6-6 (Algo) (LO6-3) The director of admissions at Kinzua University in Nova Scotia estimated the distribution of student admissions for the fall semester on the basis of past experience. Admissions Probability 1,100 0.5 1,400 0.4 1,300 0.1 Click here for the Excel Data File Required: What is the expected number of admissions for the fall semester? Compute the variance and the standard deviation of the number of admissions. Note: Round your standard deviation to 2 decimal places.arrow_forward1. Find the mean of the x-values (x-bar) and the mean of the y-values (y-bar) and write/label each here: 2. Label the second row in the table using proper notation; then, complete the table. In the fifth and sixth columns, show the 'products' of what you're multiplying, as well as the answers. X y x minus x-bar y minus y-bar (x minus x-bar)(y minus y-bar) (x minus x-bar)^2 xy 16 20 34 4-2 5 2 3. Write the sums that represents Sxx and Sxy in the table, at the bottom of their respective columns. 4. Find the slope of the Regression line: bi = (simplify your answer) 5. Find the y-intercept of the Regression line, and then write the equation of the Regression line. Show your work. Then, BOX your final answer. Express your line as "y-hat equals...arrow_forwardApply STATA commands & submit the output for each question only when indicated below i. Generate the log of birthweight and family income of children. Name these new variables Ibwght & Ifaminc. Include the output of this code. ii. Apply the command sum with the detail option to the variable faminc. Note: you should find the 25th percentile value, the 50th percentile and the 75th percentile value of faminc from the output - you will need it to answer the next question Include the output of this code. iii. iv. Use the output from part ii of this question to Generate a variable called "high_faminc" that takes a value 1 if faminc is less than or equal to the 25th percentile, it takes the value 2 if faminc is greater than 25th percentile but less than or equal to the 50th percentile, it takes the value 3 if faminc is greater than 50th percentile but less than or equal to the 75th percentile, it takes the value 4 if faminc is greater than the 75th percentile. Include the outcome of this code…arrow_forward
- solve this on paperarrow_forwardApply STATA commands & submit the output for each question only when indicated below i. Apply the command egen to create a variable called "wyd" which is the rowtotal function on variables bwght & faminc. ii. Apply the list command for the first 10 observations to show that the code in part i worked. Include the outcome of this code iii. Apply the egen command to create a new variable called "bwghtsum" using the sum function on variable bwght by the variable high_faminc (Note: need to apply the bysort' statement) iv. Apply the "by high_faminc" statement to find the V. descriptive statistics of bwght and bwghtsum Include the output of this code. Why is there a difference between the standard deviations of bwght and bwghtsum from part iv of this question?arrow_forwardAccording to a health information website, the distribution of adults’ diastolic blood pressure (in millimeters of mercury, mmHg) can be modeled by a normal distribution with mean 70 mmHg and standard deviation 20 mmHg. b. Above what diastolic pressure would classify someone in the highest 1% of blood pressures? Show all calculations used.arrow_forward
- Write STATA codes which will generate the outcomes in the questions & submit the output for each question only when indicated below i. ii. iii. iv. V. Write a code which will allow STATA to go to your favorite folder to access your files. Load the birthweight1.dta dataset from your favorite folder and save it under a different filename to protect data integrity. Call the new dataset babywt.dta (make sure to use the replace option). Verify that it contains 2,998 observations and 8 variables. Include the output of this code. Are there missing observations for variable(s) for the variables called bwght, faminc, cigs? How would you know? (You may use more than one code to show your answer(s)) Include the output of your code (s). Write the definitions of these variables: bwght, faminc, male, white, motheduc,cigs; which of these variables are categorical? [Hint: use the labels of the variables & the browse command] Who is this dataset about? Who can use this dataset to answer what kind of…arrow_forwardApply STATA commands & submit the output for each question only when indicated below İ. ii. iii. iv. V. Apply the command summarize on variables bwght and faminc. What is the average birthweight of babies and family income of the respondents? Include the output of this code. Apply the tab command on the variable called male. How many of the babies and what share of babies are male? Include the output of this code. Find the summary statistics (i.e. use the sum command) of the variables bwght and faminc if the babies are white. Include the output of this code. Find the summary statistics (i.e. use the sum command) of the variables bwght and faminc if the babies are male but not white. Include the output of this code. Using your answers to previous subparts of this question: What is the difference between the average birthweight of a baby who is male and a baby who is male but not white? What can you say anything about the difference in family income of the babies that are male and male…arrow_forwardA public health researcher is studying the impacts of nudge marketing techniques on shoppers vegetablesarrow_forward
- The director of admissions at Kinzua University in Nova Scotia estimated the distribution of student admissions for the fall semester on the basis of past experience. Admissions Probability 1,100 0.5 1,400 0.4 1,300 0.1 Click here for the Excel Data File Required: What is the expected number of admissions for the fall semester? Compute the variance and the standard deviation of the number of admissions. Note: Round your standard deviation to 2 decimal places.arrow_forwardA pollster randomly selected four of 10 available people. Required: How many different groups of 4 are possible? What is the probability that a person is a member of a group? Note: Round your answer to 3 decimal places.arrow_forwardWind Mountain is an archaeological study area located in southwestern New Mexico. Potsherds are broken pieces of prehistoric Native American clay vessels. One type of painted ceramic vessel is called Mimbres classic black-on-white. At three different sites the number of such sherds was counted in local dwelling excavations. Test given. Site I Site II Site III 63 19 60 43 34 21 23 49 51 48 11 15 16 46 26 20 31 Find .arrow_forward
arrow_back_ios
SEE MORE QUESTIONS
arrow_forward_ios
Recommended textbooks for you
 Glencoe Algebra 1, Student Edition, 9780079039897...AlgebraISBN:9780079039897Author:CarterPublisher:McGraw Hill
 Big Ideas Math A Bridge To Success Algebra 1: Stu...AlgebraISBN:9781680331141Author:HOUGHTON MIFFLIN HARCOURTPublisher:Houghton Mifflin Harcourt
 Holt Mcdougal Larson Pre-algebra: Student Edition...AlgebraISBN:9780547587776Author:HOLT MCDOUGALPublisher:HOLT MCDOUGAL
Glencoe Algebra 1, Student Edition, 9780079039897...
Algebra
ISBN:9780079039897
Author:Carter
Publisher:McGraw Hill
Big Ideas Math A Bridge To Success Algebra 1: Stu...
Algebra
ISBN:9781680331141
Author:HOUGHTON MIFFLIN HARCOURT
Publisher:Houghton Mifflin Harcourt
Holt Mcdougal Larson Pre-algebra: Student Edition...
Algebra
ISBN:9780547587776
Author:HOLT MCDOUGAL
Publisher:HOLT MCDOUGAL
The Shape of Data: Distributions: Crash Course Statistics #7; Author: CrashCourse;https://www.youtube.com/watch?v=bPFNxD3Yg6U;License: Standard YouTube License, CC-BY
Shape, Center, and Spread - Module 20.2 (Part 1); Author: Mrmathblog;https://www.youtube.com/watch?v=COaid7O_Gag;License: Standard YouTube License, CC-BY
Shape, Center and Spread; Author: Emily Murdock;https://www.youtube.com/watch?v=_YyW0DSCzpM;License: Standard Youtube License