
STATISTICS F/BUSINESS+ECONOMICS-TEXT
13th Edition
ISBN: 9781305881884
Author: Anderson
Publisher: CENGAGE L
expand_more
expand_more
format_list_bulleted
Videos
Textbook Question
Chapter 20.3, Problem 6E
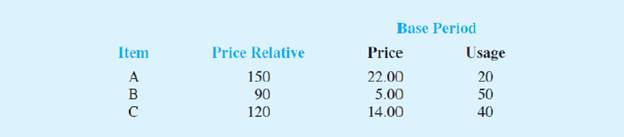
Price relatives for three items, along with base-period prices and usage are shown in the following table. Compute a weighted aggregate price index for the current period.
Expert Solution & Answer

Trending nowThis is a popular solution!

Students have asked these similar questions
Find the critical value for a left-tailed test using the F distribution with a 0.025, degrees of freedom in the numerator=12, and degrees of freedom in the
denominator = 50. A portion of the table of critical values of the F-distribution is provided.
Click the icon to view the partial table of critical values of the F-distribution.
What is the critical value?
(Round to two decimal places as needed.)
A retail store manager claims that the average daily sales of the store are $1,500.
You aim to test whether the actual average daily sales differ significantly from this claimed value.
You can provide your answer by inserting a text box and the answer must include:
Null hypothesis,
Alternative hypothesis,
Show answer (output table/summary table), and
Conclusion based on the P value.
Showing the calculation is a must. If calculation is missing,so please provide a step by step on the answers
Numerical answers in the yellow cells
Show all work
Chapter 20 Solutions
STATISTICS F/BUSINESS+ECONOMICS-TEXT
Ch. 20.2 - The following table reports prices and usage...Ch. 20.2 - An item with a price relative of 132 cost 10.75 in...Ch. 20.2 - A large manufacturer purchases an identical...Ch. 20.2 - Prob. 4ECh. 20.2 - Under the last-in, first-out (LIFO) inventory...Ch. 20.3 - Price relatives for three items, along with...Ch. 20.3 - The Mitchell Chemical Company produces a special...Ch. 20.3 - Prob. 8ECh. 20.3 - Compute the price relatives for the RB Beverages...Ch. 20.5 - Registered nurses in 2007 made an average hourly...
Ch. 20.5 - The average hourly wage rate for construction...Ch. 20.5 - Shipments of product from manufacturer to the...Ch. 20.5 - The revenue for Google for the years 2010-2014 is...Ch. 20.7 - Data on quantities of three items sold in Year 1...Ch. 20.7 - Prob. 15ECh. 20.7 - Prob. 16ECh. 20 - Many factors influence the retail price of...Ch. 20 - Nickerson Manufacturing Company has the following...Ch. 20 - Prob. 19ECh. 20 - Prob. 20ECh. 20 - Prob. 21ECh. 20 - Prob. 22ECh. 20 - Seafood price and quantity data are reported by...Ch. 20 - Prob. 24ECh. 20 - Prob. 25ECh. 20 - Prob. 26E
Knowledge Booster


Learn more about
Need a deep-dive on the concept behind this application? Look no further. Learn more about this topic, statistics and related others by exploring similar questions and additional content below.Similar questions
- Show all workarrow_forwardplease find the answers for the yellows boxes using the information and the picture belowarrow_forwardA marketing agency wants to determine whether different advertising platforms generate significantly different levels of customer engagement. The agency measures the average number of daily clicks on ads for three platforms: Social Media, Search Engines, and Email Campaigns. The agency collects data on daily clicks for each platform over a 10-day period and wants to test whether there is a statistically significant difference in the mean number of daily clicks among these platforms. Conduct ANOVA test. You can provide your answer by inserting a text box and the answer must include: also please provide a step by on getting the answers in excel Null hypothesis, Alternative hypothesis, Show answer (output table/summary table), and Conclusion based on the P value.arrow_forward
- A company found that the daily sales revenue of its flagship product follows a normal distribution with a mean of $4500 and a standard deviation of $450. The company defines a "high-sales day" that is, any day with sales exceeding $4800. please provide a step by step on how to get the answers Q: What percentage of days can the company expect to have "high-sales days" or sales greater than $4800? Q: What is the sales revenue threshold for the bottom 10% of days? (please note that 10% refers to the probability/area under bell curve towards the lower tail of bell curve) Provide answers in the yellow cellsarrow_forwardBusiness Discussarrow_forwardThe following data represent total ventilation measured in liters of air per minute per square meter of body area for two independent (and randomly chosen) samples. Analyze these data using the appropriate non-parametric hypothesis testarrow_forward
arrow_back_ios
SEE MORE QUESTIONS
arrow_forward_ios
Recommended textbooks for you

Time Series Analysis Theory & Uni-variate Forecasting Techniques; Author: Analytics University;https://www.youtube.com/watch?v=_X5q9FYLGxM;License: Standard YouTube License, CC-BY
Operations management 101: Time-series, forecasting introduction; Author: Brandoz Foltz;https://www.youtube.com/watch?v=EaqZP36ool8;License: Standard YouTube License, CC-BY