
Videos
Samples of size 5 provided the following 20 sample means for a production process that is believed to be in control.
| 95.72 | 95.24 | 95.18 |
| 95.44 | 95.46 | 95.32 |
| 95.40 | 95.44 | 95.08 |
| 95.50 | 95.80 | 95.22 |
| 95.56 | 95.22 | 95.04 |
| 95.72 | 94.82 | 95.46 |
| 95.60 | 95.78 |
- a. Based on these data, what is an estimate of the
mean when the process is in control? - b. Assume that the process standard deviation is σ = .50. Develop the
- c. Do any of the 20 sample means indicate that the process was out of control?
a.
Find the estimate of the mean when the process is in control.
Answer to Problem 16SE
The estimate of the mean for production process that is in control is 95.4.
Explanation of Solution
Calculation:
The 20 sample means for a production process are provided.
The estimate of the mean for production process is given below:
Thus, the estimate of the mean for production process that is in control is 95.4.
b.
Construct a
Answer to Problem 16SE
Output obtained using MINITAB software is given below:
Explanation of Solution
Calculation:
Upper control limits for
Lower control limits for
Software procedure:
Step-by-step software procedure to construct the
- Choose Graph > Time Series Plot or Stat > Time Series > Time Series Plot.
- Choose Simple, and then click OK.
- In Series, select Mean.
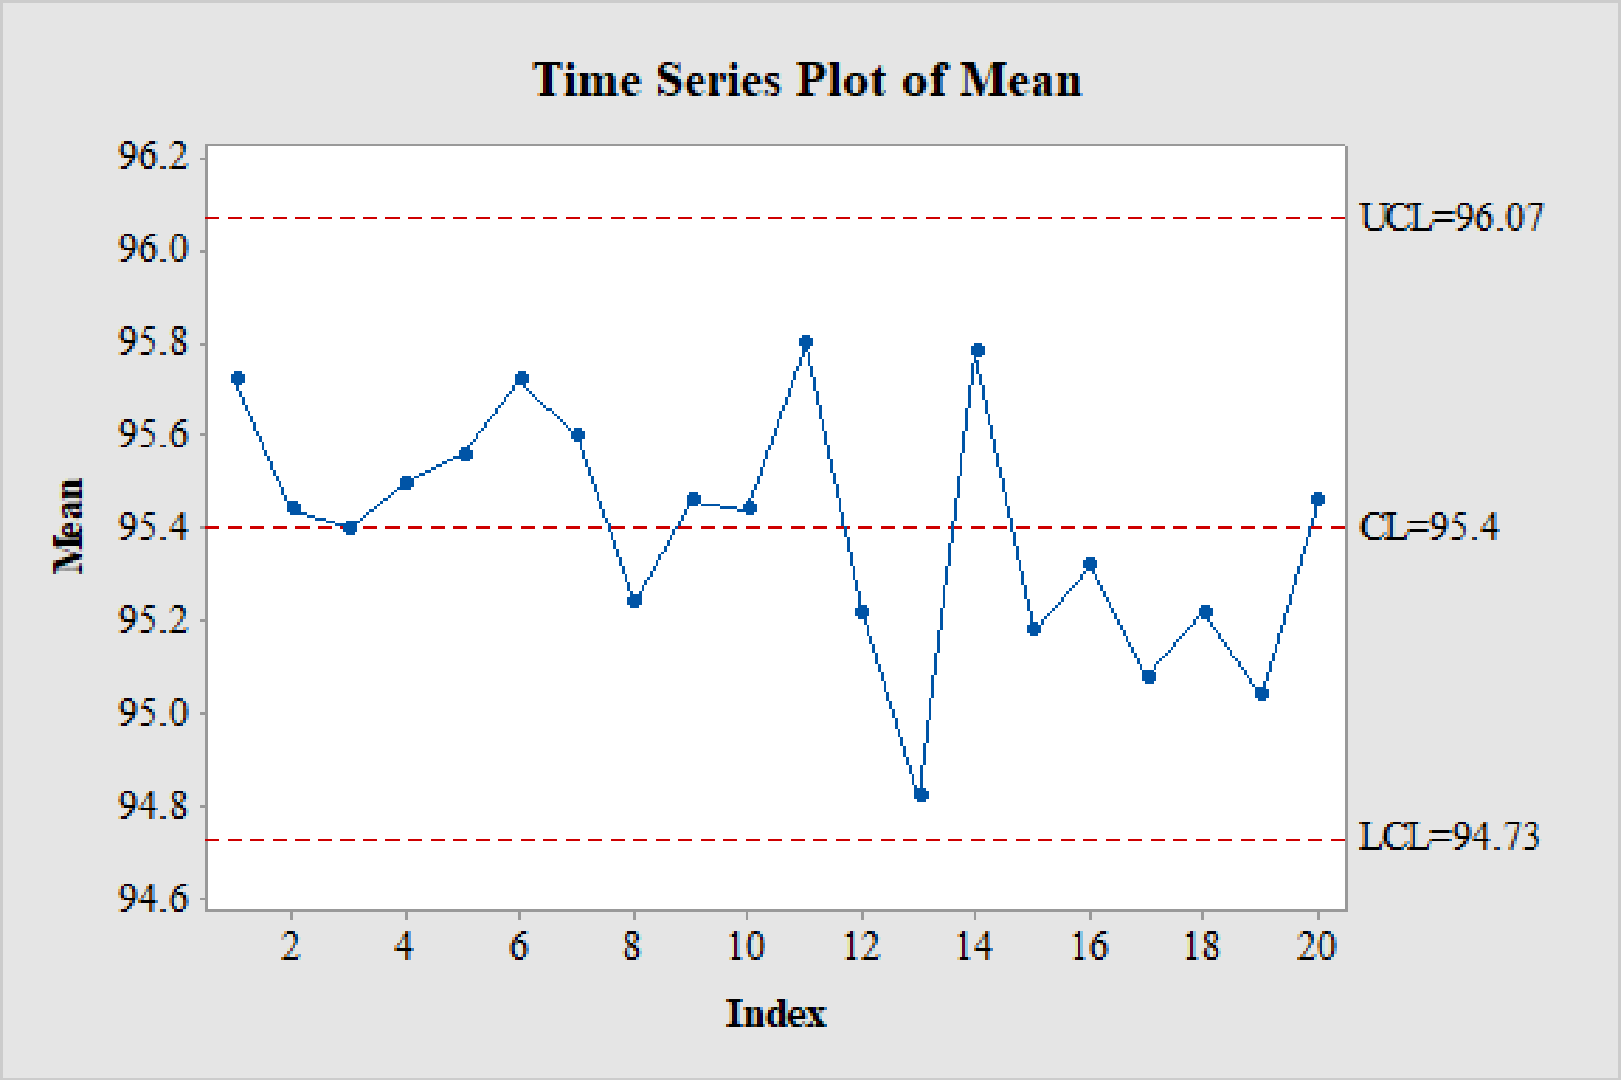
- In Show reference lines at Y values, enter 96.07, 95.4, and 94.73.
- Click OK.
Thus, the control limits for
c.
Explain whether any of the 20 sample means indicate that the process is out of control or not.
Explanation of Solution
From the
Thus, the 20 sample means do not indicate that the process was out of control.
Want to see more full solutions like this?
Chapter 19 Solutions
STATISTICS F/BUSINESS+ECONOMICS-TEXT


- Should you be confident in applying your regression equation to estimate the heart rate of a python at 35°C? Why or why not?arrow_forwardGiven your fitted regression line, what would be the residual for snake #5 (10 C)?arrow_forwardCalculate the 95% confidence interval around your estimate of r using Fisher’s z-transformation. In your final answer, make sure to back-transform to the original units.arrow_forward
- BUSINESS DISCUSSarrow_forwardA researcher wishes to estimate, with 90% confidence, the population proportion of adults who support labeling legislation for genetically modified organisms (GMOs). Her estimate must be accurate within 4% of the true proportion. (a) No preliminary estimate is available. Find the minimum sample size needed. (b) Find the minimum sample size needed, using a prior study that found that 65% of the respondents said they support labeling legislation for GMOs. (c) Compare the results from parts (a) and (b). ... (a) What is the minimum sample size needed assuming that no prior information is available? n = (Round up to the nearest whole number as needed.)arrow_forwardThe table available below shows the costs per mile (in cents) for a sample of automobiles. At a = 0.05, can you conclude that at least one mean cost per mile is different from the others? Click on the icon to view the data table. Let Hss, HMS, HLS, Hsuv and Hмy represent the mean costs per mile for small sedans, medium sedans, large sedans, SUV 4WDs, and minivans respectively. What are the hypotheses for this test? OA. Ho: Not all the means are equal. Ha Hss HMS HLS HSUV HMV B. Ho Hss HMS HLS HSUV = μMV Ha: Hss *HMS *HLS*HSUV * HMV C. Ho Hss HMS HLS HSUV =μMV = = H: Not all the means are equal. D. Ho Hss HMS HLS HSUV HMV Ha Hss HMS HLS =HSUV = HMVarrow_forward
 Glencoe Algebra 1, Student Edition, 9780079039897...AlgebraISBN:9780079039897Author:CarterPublisher:McGraw Hill
 Big Ideas Math A Bridge To Success Algebra 1: Stu...AlgebraISBN:9781680331141Author:HOUGHTON MIFFLIN HARCOURTPublisher:Houghton Mifflin Harcourt