
STATISTICS F/BUSINESS+ECONOMICS-TEXT
13th Edition
ISBN: 9781305881884
Author: Anderson
Publisher: CENGAGE L
expand_more
expand_more
format_list_bulleted
Concept explainers
Videos
Textbook Question
Chapter 18.5, Problem 32E
Consider the following set of rankings for a sample of 10 elements.
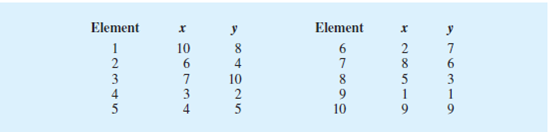
- a. Compute the Spearman rank-
correlation coefficient for the data. - b. Use α = .05 and test for significant rank correlation. What is your conclusion?
Expert Solution & Answer

Trending nowThis is a popular solution!

Students have asked these similar questions
https://www.hawkeslearning.com/Statistics/dbs2/datasets.html
NC Current Students - North Ce X | NC Canvas Login Links - North ( X
Final Exam Comprehensive x Cengage Learning
x
WASTAT - Final Exam - STAT
→
C
webassign.net/web/Student/Assignment-Responses/submit?dep=36055360&tags=autosave#question3659890_9
Part (b)
Draw a scatter plot of the ordered pairs.
N
Life
Expectancy
Life
Expectancy
80
70
600
50
40
30
20
10
Year of
1950
1970 1990
2010 Birth
O
Life
Expectancy
Part (c)
800
70
60
50
40
30
20
10
1950
1970 1990
W
ALT
林
$
#
4
R
J7
Year of
2010 Birth
F6
4+
80
70
60
50
40
30
20
10
Year of
1950 1970 1990
2010 Birth
Life
Expectancy
Ox
800
70
60
50
40
30
20
10
Year of
1950 1970 1990 2010 Birth
hp
P.B.
KA
&
7
80
% 5
H
A
B
F10
711
N
M
K
744
PRT SC
ALT
CTRL
Harvard University
California Institute of Technology
Massachusetts Institute of Technology
Stanford University
Princeton University
University of Cambridge
University of Oxford
University of California, Berkeley
Imperial College London
Yale University
University of California, Los Angeles
University of Chicago
Johns Hopkins University
Cornell University
ETH Zurich
University of Michigan
University of Toronto
Columbia University
University of Pennsylvania
Carnegie Mellon University
University of Hong Kong
University College London
University of Washington
Duke University
Northwestern University
University of Tokyo
Georgia Institute of Technology
Pohang University of Science and Technology
University of California, Santa Barbara
University of British Columbia
University of North Carolina at Chapel Hill
University of California, San Diego
University of Illinois at Urbana-Champaign
National University of Singapore
McGill…
Chapter 18 Solutions
STATISTICS F/BUSINESS+ECONOMICS-TEXT
Ch. 18.1 - The following hypothesis test is to be conducted....Ch. 18.1 - Ten individuals participated in a taste test...Ch. 18.1 - The median number of part-time employees at...Ch. 18.1 - Net assets for the 50 largest stock mutual funds...Ch. 18.1 - The median price of homes in Austin, Texas is...Ch. 18.1 - The median annual income for families living in...Ch. 18.1 - Prob. 7ECh. 18.1 - A Pew Research Center survey asked adults if their...Ch. 18.1 - In a recent poll six hundred adults were asked a...Ch. 18.1 - Nielsen Media Research identified Empire and the...
Ch. 18.1 - Competition in the personal computer market is...Ch. 18.2 - Two fuel additives are tested to determine their...Ch. 18.2 - A sample of 10 men was used in a study to test the...Ch. 18.2 - Percents of on-time arrivals for flights in the...Ch. 18.2 - A test was conducted for two overnight mail...Ch. 18.2 - The LPGA ANA Inspiration tournament was held in...Ch. 18.2 - The Scholastic Aptitude Test (SAT) consists of...Ch. 18.3 - Two fuel additives are being tested to determine...Ch. 18.3 - Samples of starting annual salaries for...Ch. 18.3 - The gap between the earnings of men and women with...Ch. 18.3 - Are Southern and Western states equally prone to...Ch. 18.3 - Each year Bloomberg Businessweek publishes...Ch. 18.3 - Police records show the following numbers of daily...Ch. 18.3 - A certain brand of microwave oven was priced at 10...Ch. 18.3 - Chicago Midway International Airport and...Ch. 18.4 - A sample of 15 consumers provided the following...Ch. 18.4 - Three admission test preparation programs are...Ch. 18.4 - Forty-minute workouts of one of the following...Ch. 18.4 - The National Football League (NFL) holds its...Ch. 18.4 - A large corporation sends many of its first-level...Ch. 18.4 - The better-selling candies are often high in...Ch. 18.5 - Consider the following set of rankings for a...Ch. 18.5 - Prob. 33ECh. 18.5 - Prob. 34ECh. 18.5 - A national study by Harris Interactive, Inc.,...Ch. 18.5 - Prob. 36ECh. 18.5 - A student organization surveyed both current...Ch. 18 - A survey asked the following question: Do you...Ch. 18 - Due to a recent decline in the housing market, the...Ch. 18 - Twelve homemakers were asked to estimate the...Ch. 18 - Prob. 41SECh. 18 - The following data are product weights for the...Ch. 18 - A client wants to determine whether there is a...Ch. 18 - Prob. 44SECh. 18 - Prob. 45SECh. 18 - Prob. 46SECh. 18 - Prob. 47SE
Knowledge Booster


Learn more about
Need a deep-dive on the concept behind this application? Look no further. Learn more about this topic, statistics and related others by exploring similar questions and additional content below.Similar questions
- Name Harvard University California Institute of Technology Massachusetts Institute of Technology Stanford University Princeton University University of Cambridge University of Oxford University of California, Berkeley Imperial College London Yale University University of California, Los Angeles University of Chicago Johns Hopkins University Cornell University ETH Zurich University of Michigan University of Toronto Columbia University University of Pennsylvania Carnegie Mellon University University of Hong Kong University College London University of Washington Duke University Northwestern University University of Tokyo Georgia Institute of Technology Pohang University of Science and Technology University of California, Santa Barbara University of British Columbia University of North Carolina at Chapel Hill University of California, San Diego University of Illinois at Urbana-Champaign National University of Singapore…arrow_forwardA company found that the daily sales revenue of its flagship product follows a normal distribution with a mean of $4500 and a standard deviation of $450. The company defines a "high-sales day" that is, any day with sales exceeding $4800. please provide a step by step on how to get the answers in excel Q: What percentage of days can the company expect to have "high-sales days" or sales greater than $4800? Q: What is the sales revenue threshold for the bottom 10% of days? (please note that 10% refers to the probability/area under bell curve towards the lower tail of bell curve) Provide answers in the yellow cellsarrow_forwardFind the critical value for a left-tailed test using the F distribution with a 0.025, degrees of freedom in the numerator=12, and degrees of freedom in the denominator = 50. A portion of the table of critical values of the F-distribution is provided. Click the icon to view the partial table of critical values of the F-distribution. What is the critical value? (Round to two decimal places as needed.)arrow_forward
- A retail store manager claims that the average daily sales of the store are $1,500. You aim to test whether the actual average daily sales differ significantly from this claimed value. You can provide your answer by inserting a text box and the answer must include: Null hypothesis, Alternative hypothesis, Show answer (output table/summary table), and Conclusion based on the P value. Showing the calculation is a must. If calculation is missing,so please provide a step by step on the answers Numerical answers in the yellow cellsarrow_forwardShow all workarrow_forwardShow all workarrow_forward
arrow_back_ios
SEE MORE QUESTIONS
arrow_forward_ios
Recommended textbooks for you
 Glencoe Algebra 1, Student Edition, 9780079039897...AlgebraISBN:9780079039897Author:CarterPublisher:McGraw Hill
 Holt Mcdougal Larson Pre-algebra: Student Edition...AlgebraISBN:9780547587776Author:HOLT MCDOUGALPublisher:HOLT MCDOUGAL
 Big Ideas Math A Bridge To Success Algebra 1: Stu...AlgebraISBN:9781680331141Author:HOUGHTON MIFFLIN HARCOURTPublisher:Houghton Mifflin Harcourt
Glencoe Algebra 1, Student Edition, 9780079039897...
Algebra
ISBN:9780079039897
Author:Carter
Publisher:McGraw Hill
Holt Mcdougal Larson Pre-algebra: Student Edition...
Algebra
ISBN:9780547587776
Author:HOLT MCDOUGAL
Publisher:HOLT MCDOUGAL
Big Ideas Math A Bridge To Success Algebra 1: Stu...
Algebra
ISBN:9781680331141
Author:HOUGHTON MIFFLIN HARCOURT
Publisher:Houghton Mifflin Harcourt
Correlation Vs Regression: Difference Between them with definition & Comparison Chart; Author: Key Differences;https://www.youtube.com/watch?v=Ou2QGSJVd0U;License: Standard YouTube License, CC-BY
Correlation and Regression: Concepts with Illustrative examples; Author: LEARN & APPLY : Lean and Six Sigma;https://www.youtube.com/watch?v=xTpHD5WLuoA;License: Standard YouTube License, CC-BY