
Mathematical Statistics with Applications
7th Edition
ISBN: 9780495110811
Author: Dennis Wackerly, William Mendenhall, Richard L. Scheaffer
Publisher: Cengage Learning
expand_more
expand_more
format_list_bulleted
Videos
Textbook Question
Chapter 15.4, Problem 12E
The accompanying table gives the scores of a group of 15 students in mathematics and art.
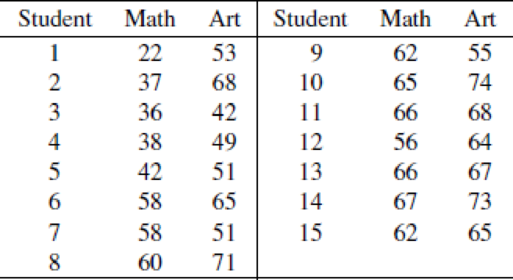
- a Use Wilcoxon’s signed-rank test to determine if the locations of the distributions of scores for these students differ significantly for the two subjects. Give bounds for the p-value and indicate the appropriate conclusion with α = .05.
- b State specific null and alternative hypotheses for the test that you conducted in part (a).
Expert Solution & Answer
Want to see the full answer?
Check out a sample textbook solution
Students have asked these similar questions
NC Current Students - North Ce X | NC Canvas Login Links - North ( X
Final Exam Comprehensive x Cengage Learning
x
WASTAT - Final Exam - STAT
→
C
webassign.net/web/Student/Assignment-Responses/submit?dep=36055360&tags=autosave#question3659890_9
Part (b)
Draw a scatter plot of the ordered pairs.
N
Life
Expectancy
Life
Expectancy
80
70
600
50
40
30
20
10
Year of
1950
1970 1990
2010 Birth
O
Life
Expectancy
Part (c)
800
70
60
50
40
30
20
10
1950
1970 1990
W
ALT
林
$
#
4
R
J7
Year of
2010 Birth
F6
4+
80
70
60
50
40
30
20
10
Year of
1950 1970 1990
2010 Birth
Life
Expectancy
Ox
800
70
60
50
40
30
20
10
Year of
1950 1970 1990 2010 Birth
hp
P.B.
KA
&
7
80
% 5
H
A
B
F10
711
N
M
K
744
PRT SC
ALT
CTRL
Harvard University
California Institute of Technology
Massachusetts Institute of Technology
Stanford University
Princeton University
University of Cambridge
University of Oxford
University of California, Berkeley
Imperial College London
Yale University
University of California, Los Angeles
University of Chicago
Johns Hopkins University
Cornell University
ETH Zurich
University of Michigan
University of Toronto
Columbia University
University of Pennsylvania
Carnegie Mellon University
University of Hong Kong
University College London
University of Washington
Duke University
Northwestern University
University of Tokyo
Georgia Institute of Technology
Pohang University of Science and Technology
University of California, Santa Barbara
University of British Columbia
University of North Carolina at Chapel Hill
University of California, San Diego
University of Illinois at Urbana-Champaign
National University of Singapore
McGill…
Name
Harvard University
California Institute of Technology
Massachusetts Institute of Technology
Stanford University
Princeton University
University of Cambridge
University of Oxford
University of California, Berkeley
Imperial College London
Yale University
University of California, Los Angeles
University of Chicago
Johns Hopkins University
Cornell University
ETH Zurich
University of Michigan
University of Toronto
Columbia University
University of Pennsylvania
Carnegie Mellon University
University of Hong Kong
University College London
University of Washington
Duke University
Northwestern University
University of Tokyo
Georgia Institute of Technology
Pohang University of Science and Technology
University of California, Santa Barbara
University of British Columbia
University of North Carolina at Chapel Hill
University of California, San Diego
University of Illinois at Urbana-Champaign
National University of Singapore…
Chapter 15 Solutions
Mathematical Statistics with Applications
Ch. 15.3 - What significance levels between = .01 and = .15...Ch. 15.3 - Prob. 2ECh. 15.3 - Clinical data concerning the effectiveness of two...Ch. 15.3 - Prob. 4ECh. 15.3 - New food products are frequently subjected to...Ch. 15.3 - On clear, cold nights in the central Florida...Ch. 15.3 - A psychological experiment was conducted to...Ch. 15.3 - Refer to Exercise 12.15. Using the sign test, do...Ch. 15.3 - Prob. 9ECh. 15.4 - The accompanying table gives the scores of a group...
Ch. 15.4 - Refer to Exercise 15.4. What answers are obtained...Ch. 15.4 - Refer to Exercise 15.6(a). Answer the question by...Ch. 15.4 - Eight subjects were asked to perform a simple...Ch. 15.4 - Two methods, A and B, for controlling traffic were...Ch. 15.4 - Dental researchers have developed a new material...Ch. 15.4 - Refer to Exercise 12.16. With = .01, use the...Ch. 15.4 - Suppose that Y1, Y2,, Yn is a random sample from a...Ch. 15.4 - The spokesperson for an organization supporting...Ch. 15.6 - Find the p-values associated with each of the...Ch. 15.6 - In some tests of healthy, elderly men, a new drug...Ch. 15.6 - Two plastics, each produced by a different...Ch. 15.6 - Prob. 24ECh. 15.6 - Prob. 25ECh. 15.6 - Prob. 26ECh. 15.6 - Prob. 27ECh. 15.6 - Prob. 28ECh. 15.7 - The table that follows contains data on the leaf...Ch. 15.7 - Prob. 30ECh. 15.7 - Three different brands of magnetron tubes (the key...Ch. 15.7 - An experiment was conducted to compare the length...Ch. 15.7 - Prob. 33ECh. 15.7 - Prob. 34ECh. 15.7 - Prob. 35ECh. 15.8 - In a study of palatability of antibiotics for...Ch. 15.8 - Prob. 38ECh. 15.8 - Prob. 39ECh. 15.8 - A serious drought-related problem for farmers is...Ch. 15.8 - Prob. 41ECh. 15.8 - Prob. 42ECh. 15.8 - Prob. 43ECh. 15.8 - Prob. 44ECh. 15.8 - Prob. 45ECh. 15.9 - Prob. 46ECh. 15.9 - Prob. 47ECh. 15.9 - Prob. 48ECh. 15.9 - Prob. 49ECh. 15.9 - Prob. 50ECh. 15.9 - Prob. 52ECh. 15.10 - Prob. 53ECh. 15.10 - Prob. 54ECh. 15.10 - Prob. 55ECh. 15.10 - Prob. 56ECh. 15.10 - Prob. 57ECh. 15.10 - Prob. 58ECh. 15.10 - Refer to Exercise 11.4. Regard both book and...Ch. 15.10 - Prob. 60ECh. 15 - Prob. 62SECh. 15 - Prob. 63SECh. 15 - Prob. 64SECh. 15 - Prob. 65SECh. 15 - Prob. 67SECh. 15 - Prob. 69SECh. 15 - Prob. 70SECh. 15 - Prob. 71SECh. 15 - Prob. 72SECh. 15 - Prob. 74SECh. 15 - Prob. 75SECh. 15 - Prob. 76SECh. 15 - Prob. 77SECh. 15 - Prob. 78SE
Knowledge Booster


Learn more about
Need a deep-dive on the concept behind this application? Look no further. Learn more about this topic, statistics and related others by exploring similar questions and additional content below.Similar questions
- A company found that the daily sales revenue of its flagship product follows a normal distribution with a mean of $4500 and a standard deviation of $450. The company defines a "high-sales day" that is, any day with sales exceeding $4800. please provide a step by step on how to get the answers in excel Q: What percentage of days can the company expect to have "high-sales days" or sales greater than $4800? Q: What is the sales revenue threshold for the bottom 10% of days? (please note that 10% refers to the probability/area under bell curve towards the lower tail of bell curve) Provide answers in the yellow cellsarrow_forwardFind the critical value for a left-tailed test using the F distribution with a 0.025, degrees of freedom in the numerator=12, and degrees of freedom in the denominator = 50. A portion of the table of critical values of the F-distribution is provided. Click the icon to view the partial table of critical values of the F-distribution. What is the critical value? (Round to two decimal places as needed.)arrow_forwardA retail store manager claims that the average daily sales of the store are $1,500. You aim to test whether the actual average daily sales differ significantly from this claimed value. You can provide your answer by inserting a text box and the answer must include: Null hypothesis, Alternative hypothesis, Show answer (output table/summary table), and Conclusion based on the P value. Showing the calculation is a must. If calculation is missing,so please provide a step by step on the answers Numerical answers in the yellow cellsarrow_forward
arrow_back_ios
SEE MORE QUESTIONS
arrow_forward_ios
Recommended textbooks for you
 Holt Mcdougal Larson Pre-algebra: Student Edition...AlgebraISBN:9780547587776Author:HOLT MCDOUGALPublisher:HOLT MCDOUGAL
 Glencoe Algebra 1, Student Edition, 9780079039897...AlgebraISBN:9780079039897Author:CarterPublisher:McGraw Hill
Holt Mcdougal Larson Pre-algebra: Student Edition...
Algebra
ISBN:9780547587776
Author:HOLT MCDOUGAL
Publisher:HOLT MCDOUGAL
Glencoe Algebra 1, Student Edition, 9780079039897...
Algebra
ISBN:9780079039897
Author:Carter
Publisher:McGraw Hill
Hypothesis Testing using Confidence Interval Approach; Author: BUM2413 Applied Statistics UMP;https://www.youtube.com/watch?v=Hq1l3e9pLyY;License: Standard YouTube License, CC-BY
Hypothesis Testing - Difference of Two Means - Student's -Distribution & Normal Distribution; Author: The Organic Chemistry Tutor;https://www.youtube.com/watch?v=UcZwyzwWU7o;License: Standard Youtube License