Bundle: Essentials of Statistics for The Behavioral Sciences, Loose-Leaf Version, 9th + Aplia, 1 term Printed Access Card
9th Edition
ISBN: 9781337593830
Author: Frederick J Gravetter, Larry B. Wallnau, Lori-Ann B. Forzano
Publisher: Cengage Learning
expand_more
expand_more
format_list_bulleted
Videos
Textbook Question
Chapter 15, Problem 6P
A professor in the psychology department would like to determine whether there has been a significant change in grading practices over the years. It is known that the overall grade distribution for the department in 1985 had 14% As. 26% Bs, 31% Cs. 19% Ds. and 10% Fs. A sample of n = 200 psychology students from last semester produced the following grade distribution:
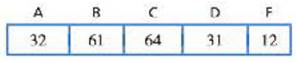
Do the data indicate a significant change in the grade distribution? Test at the .05 level of significance.
Expert Solution & Answer
Want to see the full answer?
Check out a sample textbook solution
Students have asked these similar questions
Question 3
The following stem-and-leaf displays the weekly salary of employees at this firm.
Stem-and-Leaf Display
Leaf Unit = 10.0
N=x
5
3 00123
12 4 0125888
(y)
5 11234456777
z
6 13568
5
7 154
2
8 46
i.
Determine the value of x, y and z.
[3]
ii. What is the value of the median?
[2]
iii.
Find the mode of this data set.
iv.
Calculate the range
[1]
[2]
Let Y be a continuous RV with PDF
otherwise
Find the CDF, Fry), of Y .
Find an expression for pth, p € (0, 1), quantile of the distribution.
Find E(Y) and V(Y).
Find E(-2Y + 1) and V(-3Y - 2).
Find E(Y3).
Let X be a continuous RV with CDF
Find P(X < 0), P(-1 < X < 1) and P(0.5 < X).
Based on your answers to the above questions, what is the median of the distribu-tion? Why
Find the PDF, fx (x), of X.
Chapter 15 Solutions
Bundle: Essentials of Statistics for The Behavioral Sciences, Loose-Leaf Version, 9th + Aplia, 1 term Printed Access Card
Ch. 15.1 - Which of the following is a characteristic of...Ch. 15.1 - Which of the following accurately describes the...Ch. 15.1 - A researcher uses a sample of n = 60 participants...Ch. 15.2 - Prob. 1LCCh. 15.2 - Prob. 2LCCh. 15.2 - A researcher uses a sample of 20 college...Ch. 15.3 - If a chi-square test for independence has df 3,...Ch. 15.3 - Prob. 2LCCh. 15.3 - Prob. 3LCCh. 15.4 - Prob. 1LC
Ch. 15.4 - A researcher obtains X2 = 4.0 for a test for...Ch. 15.4 - Under what circumstances should the chi-square...Ch. 15.5 - Prob. 1LCCh. 15.5 - Prob. 2LCCh. 15 - Prob. 1PCh. 15 - The student population at the state college...Ch. 15 - A developmental psychologist would like to deter...Ch. 15 - Data from the Department of Motor Vehicles...Ch. 15 - A psychologist examining art appreciation selected...Ch. 15 - A professor in the psychology department would...Ch. 15 - Automobile insurance is much more expensive for...Ch. 15 - A communications company has developed three new...Ch. 15 - Prob. 9PCh. 15 - Earlier in the chapter, we introduced the...Ch. 15 - Liu el al. (2015) recently reported the results of...Ch. 15 - Many businesses use some type of customer loyalty...Ch. 15 - In a classic study, Loftus and Palmer (1974)...Ch. 15 - In a study investigating freshman weight pain, the...Ch. 15 - Research results suggest that IQ scores for boys...Ch. 15 - Gender differences in dream content are well...Ch. 15 - Many parents allow their underage children to...Ch. 15 - A recent study indicates that people tend to...Ch. 15 - Research indicates that people who volunteer to...Ch. 15 - Research has demonstrated strong gender...
Knowledge Booster


Learn more about
Need a deep-dive on the concept behind this application? Look no further. Learn more about this topic, statistics and related others by exploring similar questions and additional content below.Similar questions
- A survey of 581 citizens found that 313 of them favor a new bill introduced by the city. We want to find a 95% confidence interval for the true proportion of the population who favor the bill. What is the lower limit of the interval? Enter the result as a decimal rounded to 3 decimal digits. Your Answer:arrow_forwardLet X be a continuous RV with PDF where a > 0 and 0 > 0 are parameters. verify that f-∞ /x (x)dx = 1. Find the CDF, Fx (7), of X.arrow_forward6. [20] Let X be a continuous RV with PDF 2(1), 1≤x≤2 fx(x) = 0, otherwisearrow_forward
- A survey of 581 citizens found that 313 of them favor a new bill introduced by the city. We want to find a 95% confidence interval for the true proportion of the population who favor the bill. What is the lower limit of the interval? Enter the result as a decimal rounded to 3 decimal digits. Your Answer:arrow_forwardA survey of 581 citizens found that 313 of them favor a new bill introduced by the city. We want to find a 95% confidence interval for the true proportion of the population who favor the bill. What is the lower limit of the interval? Enter the result as a decimal rounded to 3 decimal digits. Your Answer:arrow_forward2. The SMSA data consisting of 141 observations on 10 variables is fitted by the model below: 1 y = Bo+B1x4 + ẞ2x6 + ẞ3x8 + √1X4X8 + V2X6X8 + €. See Question 2, Tutorial 3 for the meaning of the variables in the above model. The following results are obtained: Estimate Std. Error t value Pr(>|t|) (Intercept) 1.302e+03 4.320e+02 3.015 0.00307 x4 x6 x8 x4:x8 x6:x8 -1.442e+02 2.056e+01 -7.013 1.02e-10 6.340e-01 6.099e+00 0.104 0.91737 -9.455e-02 5.802e-02 -1.630 0.10550 2.882e-02 2.589e-03 11.132 1.673e-03 7.215e-04 2.319 F) x4 1 3486722 3486722 17.9286 4.214e-05 x6 1 14595537 x8 x4:x8 x6:x8 1 132.4836 < 2.2e-16 1045693 194478 5.3769 0.02191 1 1198603043 1198603043 6163.1900 < 2.2e-16 1 25765100 25765100 1045693 Residuals 135 26254490 Estimated variance matrix (Intercept) x4 x6 x8 x4:x8 x6:x8 (Intercept) x4 x6 x8 x4:x8 x6:x8 0.18875694 1.866030e+05 -5.931735e+03 -2.322825e+03 -16.25142055 0.57188953 -5.931735e+03 4.228816e+02 3.160915e+01 0.61621781 -0.03608028 -0.00445013 -2.322825e+03…arrow_forward
- In some applications the distribution of a discrete RV, X resembles the Poisson distribution except that 0 is not a possible value of X. Consider such a RV with PMF where 1 > 0 is a parameter, and c is a constant. (a) Find the expression of c in terms of 1. (b) Find E(X). (Hint: You can use the fact that, if Y ~ Poisson(1), the E(Y) = 1.)arrow_forwardSuppose that X ~Bin(n,p). Show that E[(1 - p)] = (1-p²)".arrow_forwardI need help with this problem and an explanation of the solution for the image described below. (Statistics: Engineering Probabilities)arrow_forward
- I need help with this problem and an explanation of the solution for the image described below. (Statistics: Engineering Probabilities)arrow_forwardThis exercise is based on the following data on four bodybuilding supplements. (Figures shown correspond to a single serving.) Creatine(grams) L-Glutamine(grams) BCAAs(grams) Cost($) Xtend(SciVation) 0 2.5 7 1.00 Gainz(MP Hardcore) 2 3 6 1.10 Strongevity(Bill Phillips) 2.5 1 0 1.20 Muscle Physique(EAS) 2 2 0 1.00 Your personal trainer suggests that you supplement with at least 10 grams of creatine, 39 grams of L-glutamine, and 90 grams of BCAAs each week. You are thinking of combining Xtend and Gainz to provide you with the required nutrients. How many servings of each should you combine to obtain a week's supply that meets your trainer's specifications at the least cost? (If an answer does not exist, enter DNE.) servings of xtend servings of gainzarrow_forwardI need help with this problem and an explanation of the solution for the image described below. (Statistics: Engineering Probabilities)arrow_forward
arrow_back_ios
SEE MORE QUESTIONS
arrow_forward_ios
Recommended textbooks for you
 Glencoe Algebra 1, Student Edition, 9780079039897...AlgebraISBN:9780079039897Author:CarterPublisher:McGraw Hill
Glencoe Algebra 1, Student Edition, 9780079039897...
Algebra
ISBN:9780079039897
Author:Carter
Publisher:McGraw Hill
Hypothesis Testing using Confidence Interval Approach; Author: BUM2413 Applied Statistics UMP;https://www.youtube.com/watch?v=Hq1l3e9pLyY;License: Standard YouTube License, CC-BY
Hypothesis Testing - Difference of Two Means - Student's -Distribution & Normal Distribution; Author: The Organic Chemistry Tutor;https://www.youtube.com/watch?v=UcZwyzwWU7o;License: Standard Youtube License