
Mindtap Psychology, 1 Term (6 Months) Printed Access Card, Enhanced For Gravetter/wallnau/forzano's Essentials Of Statistics For The Behavioral Sciences
9th Edition
ISBN: 9780357035092
Author: GRAVETTER, Frederick J; Forzano, Lori-ann B.; Wallnau, Larry B.
Publisher: Cengage Learning
expand_more
expand_more
format_list_bulleted
Concept explainers
Videos
Textbook Question
Chapter 15, Problem 14P
In a study investigating freshman weight pain, the researchers also looked at gender differences in weight (Kasparek, Corwin, Valois, Sargent & Morris, 2008). Using self-reported heights and weights, they computed the Body Mass Index (BMI) for each student Based on the BMI scores, the students were classified as cither desirable weight or overweight. When the students were further classified by gender, the researchers found results similar to the frequencies in the following table:
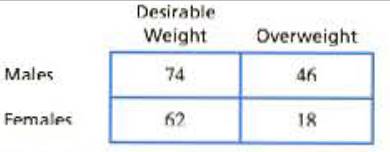
- a. Do the data indicate that the proportion of overweight men is significantly different from the proportion of overweight women? Test with α = .05.
- b. Compute the phi-coefficient to measure the strength of the relationship.
- c. Write a sentence demonstrating how the outcome of the hypothesis test and the measure or effect size would be reported in a journal article.
Expert Solution & Answer
Want to see the full answer?
Check out a sample textbook solution
Students have asked these similar questions
Question 2
Parts manufactured by an injection molding process are subjected to a compressive strength test. Twenty samples
of five parts each are collected, and the compressive strengths (in psi) are shown in Table 2.
Table 2: Strength Data for Question 2
Sample Number
x1
x2
23
x4
x5
R
1
83.0
2
88.6 78.3 78.8
3
85.7
75.8
84.3
81.2 78.7 75.7 77.0
71.0 84.2
81.0
79.1
7.3
80.2 17.6
75.2
80.4
10.4
4
80.8
74.4
82.5
74.1 75.7 77.5
8.4
5
83.4
78.4
82.6 78.2
78.9
80.3
5.2
File Preview
6
75.3
79.9
87.3 89.7
81.8
82.8
14.5
7
74.5
78.0 80.8
73.4
79.7
77.3
7.4
8
79.2
84.4 81.5 86.0
74.5
81.1
11.4
9
80.5
86.2
76.2 64.1
80.2
81.4
9.9
10
75.7
75.2
71.1 82.1
74.3
75.7
10.9
11
80.0 81.5
78.4 73.8
78.1
78.4
7.7
12
80.6
81.8
79.3
73.8
81.7 79.4
8.0
13
82.7
81.3
79.1
82.0 79.5 80.9
3.6
14
79.2
74.9
78.6 77.7
75.3
77.1
4.3
15
85.5 82.1
82.8 73.4
71.7
79.1
13.8
16
78.8 79.6
80.2 79.1
80.8 79.7
2.0
17
82.1
78.2
18
84.5
76.9
75.5
83.5 81.2
19
79.0 77.8
20
84.5
73.1
78.2 82.1
79.2 81.1 7.6
81.2 84.4 81.6 80.8…
Name:
Lab Time:
Quiz 7 & 8 (Take Home) - due Wednesday, Feb. 26
Contingency Analysis (Ch. 9)
In lab 5, part 3, you will create a mosaic plot and conducted a chi-square contingency test to
evaluate whether elderly patients who did not stop walking to talk (vs. those who did stop)
were more likely to suffer a fall in the next six months. I have tabulated the data below.
Answer the questions below. Please show your calculations on this or a separate sheet.
Did not stop walking to talk
Stopped walking to talk Totals
Suffered a fall
Did not suffer a fall
Totals
12
11
23
2
35
37
14
14
46
60
Quiz 7:
1. (2 pts) Compute the odds of falling for each group. Compute the odds ratio for those
who did not stop walking vs. those who did stop walking. Interpret your result verbally.
Solve please and thank you!
Chapter 15 Solutions
Mindtap Psychology, 1 Term (6 Months) Printed Access Card, Enhanced For Gravetter/wallnau/forzano's Essentials Of Statistics For The Behavioral Sciences
Ch. 15.1 - Which of the following is a characteristic of...Ch. 15.1 - Which of the following accurately describes the...Ch. 15.1 - A researcher uses a sample of n = 60 participants...Ch. 15.2 - Prob. 1LCCh. 15.2 - Prob. 2LCCh. 15.2 - A researcher uses a sample of 20 college...Ch. 15.3 - If a chi-square test for independence has df 3,...Ch. 15.3 - Prob. 2LCCh. 15.3 - Prob. 3LCCh. 15.4 - Prob. 1LC
Ch. 15.4 - A researcher obtains X2 = 4.0 for a test for...Ch. 15.4 - Under what circumstances should the chi-square...Ch. 15.5 - Prob. 1LCCh. 15.5 - Prob. 2LCCh. 15 - Prob. 1PCh. 15 - The student population at the state college...Ch. 15 - A developmental psychologist would like to deter...Ch. 15 - Data from the Department of Motor Vehicles...Ch. 15 - A psychologist examining art appreciation selected...Ch. 15 - A professor in the psychology department would...Ch. 15 - Automobile insurance is much more expensive for...Ch. 15 - A communications company has developed three new...Ch. 15 - Prob. 9PCh. 15 - Earlier in the chapter, we introduced the...Ch. 15 - Liu el al. (2015) recently reported the results of...Ch. 15 - Many businesses use some type of customer loyalty...Ch. 15 - In a classic study, Loftus and Palmer (1974)...Ch. 15 - In a study investigating freshman weight pain, the...Ch. 15 - Research results suggest that IQ scores for boys...Ch. 15 - Gender differences in dream content are well...Ch. 15 - Many parents allow their underage children to...Ch. 15 - A recent study indicates that people tend to...Ch. 15 - Research indicates that people who volunteer to...Ch. 15 - Research has demonstrated strong gender...
Knowledge Booster


Learn more about
Need a deep-dive on the concept behind this application? Look no further. Learn more about this topic, statistics and related others by exploring similar questions and additional content below.Similar questions
- 7. In a 2011 article, M. Radelet and G. Pierce reported a logistic prediction equation for the death penalty verdicts in North Carolina. Let Y denote whether a subject convicted of murder received the death penalty (1=yes), for the defendant's race h (h1, black; h = 2, white), victim's race i (i = 1, black; i = 2, white), and number of additional factors j (j = 0, 1, 2). For the model logit[P(Y = 1)] = a + ß₁₂ + By + B²², they reported = -5.26, D â BD = 0, BD = 0.17, BY = 0, BY = 0.91, B = 0, B = 2.02, B = 3.98. (a) Estimate the probability of receiving the death penalty for the group most likely to receive it. [4 pts] (b) If, instead, parameters used constraints 3D = BY = 35 = 0, report the esti- mates. [3 pts] h (c) If, instead, parameters used constraints Σ₁ = Σ₁ BY = Σ; B = 0, report the estimates. [3 pts] Hint the probabilities, odds and odds ratios do not change with constraints.arrow_forwardSolve please and thank you!arrow_forwardSolve please and thank you!arrow_forward
- Question 1:We want to evaluate the impact on the monetary economy for a company of two types of strategy (competitive strategy, cooperative strategy) adopted by buyers.Competitive strategy: strategy characterized by firm behavior aimed at obtaining concessions from the buyer.Cooperative strategy: a strategy based on a problem-solving negotiating attitude, with a high level of trust and cooperation.A random sample of 17 buyers took part in a negotiation experiment in which 9 buyers adopted the competitive strategy, and the other 8 the cooperative strategy. The savings obtained for each group of buyers are presented in the pdf that i sent: For this problem, we assume that the samples are random and come from two normal populations of unknown but equal variances.According to the theory, the average saving of buyers adopting a competitive strategy will be lower than that of buyers adopting a cooperative strategy.a) Specify the population identifications and the hypotheses H0 and H1…arrow_forwardYou assume that the annual incomes for certain workers are normal with a mean of $28,500 and a standard deviation of $2,400. What’s the chance that a randomly selected employee makes more than $30,000?What’s the chance that 36 randomly selected employees make more than $30,000, on average?arrow_forwardWhat’s the chance that a fair coin comes up heads more than 60 times when you toss it 100 times?arrow_forward
- Suppose that you have a normal population of quiz scores with mean 40 and standard deviation 10. Select a random sample of 40. What’s the chance that the mean of the quiz scores won’t exceed 45?Select one individual from the population. What’s the chance that his/her quiz score won’t exceed 45?arrow_forwardSuppose that you take a sample of 100 from a population that contains 45 percent Democrats. What sample size condition do you need to check here (if any)?What’s the standard error of ^P?Compare the standard errors of ^p n=100 for ,n=1000 , n=10,000, and comment.arrow_forwardSuppose that a class’s test scores have a mean of 80 and standard deviation of 5. You choose 25 students from the class. What’s the chance that the group’s average test score is more than 82?arrow_forward
- Suppose that you collect data on 10 products and check their weights. The average should be 10 ounces, but your sample mean is 9 ounces with standard deviation 2 ounces. Find the standard score.What percentile is the standard score found in part a of this question closest to?Suppose that the mean really is 10 ounces. Do you find these results unusual? Use probabilities to explain.arrow_forwardSuppose that you want to sample expensive computer chips, but you can have only n=3 of them. Should you continue the experiment?arrow_forwardSuppose that studies claim that 40 percent of cellphone owners use their phones in the car while driving. What’s the chance that more than 425 out of a random sample of 1,000 cellphone owners say they use their phones while driving?arrow_forward
arrow_back_ios
SEE MORE QUESTIONS
arrow_forward_ios
Recommended textbooks for you
 Glencoe Algebra 1, Student Edition, 9780079039897...AlgebraISBN:9780079039897Author:CarterPublisher:McGraw Hill
 Big Ideas Math A Bridge To Success Algebra 1: Stu...AlgebraISBN:9781680331141Author:HOUGHTON MIFFLIN HARCOURTPublisher:Houghton Mifflin Harcourt
Glencoe Algebra 1, Student Edition, 9780079039897...
Algebra
ISBN:9780079039897
Author:Carter
Publisher:McGraw Hill
Big Ideas Math A Bridge To Success Algebra 1: Stu...
Algebra
ISBN:9781680331141
Author:HOUGHTON MIFFLIN HARCOURT
Publisher:Houghton Mifflin Harcourt
Sampling Methods and Bias with Surveys: Crash Course Statistics #10; Author: CrashCourse;https://www.youtube.com/watch?v=Rf-fIpB4D50;License: Standard YouTube License, CC-BY
Statistics: Sampling Methods; Author: Mathispower4u;https://www.youtube.com/watch?v=s6ApdTvgvOs;License: Standard YouTube License, CC-BY