
Concept explainers
Videos
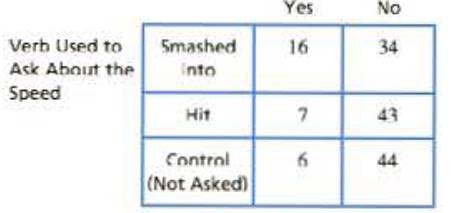
In a classic study, Loftus and Palmer (1974) investigated the relationship between memory for eyewitnesses and the questions they are asked. In the study, participants watched a film of an automobile accident and then were questioned about the accident. One group was asked how fast the cars were going when they "smashed into" each other. A second group was asked about the speed when the ears "hit" each other and a third group was not asked any question about the speed of the ears. A week later, the participants returned to answer additional questions about the accident, including whether they recalled seeing any broken glass. Although there was no broken glass in the film, several students claimed to remember seeing it. The following table shows the Frequency distribution of responses for each group.
- a. Does the proportion of participants who claim to remember broken glass differ significantly from group to group? Test with or α = .05
- b. Compute Cramér's V to measure the size of the treatment effect.
- c. Describe how the phrasing of the question influenced the participants' memories.
- d. Write a sentence demonstrating how the outcome of the hypothesis lest and the measure of effect size would be reported in a journal article
a.
To check: Whether the proportions of participants who claim to remember broken glass differ significantly from group to group for the given question.
Answer to Problem 13P
Explanation of Solution
Given info:
A sample of 150 students were involved in a study based on “the response they gave regarding the broken glass or verb used for speed”. The distribution is given in the question. Use
Calculations:
Step 1: Null Hypothesis and Alternate Hypothesis are:
Step 2: For the given sample, degrees of freedom equals:
With
Step 3:
The formula to calculate expected frequency is:
Substitute
For the category “smashed into”, the expected frequencies are:
For the category “Hit”, the expected frequencies are:
Similarly, for the category “control”, the expected frequencies are:
The observed and expected frequency is given below:
| Yes | No | Total | |
| Smashed into | 16 (9.66) | 34 (40.33) | 50 |
| Hit | 7 (9.66) | 43 (40.33) | 50 |
| Control (not asked) | 6 (9.66) | 44 (40.33) | 50 |
| Total | 29 | 121 | 150 |
Here the values within the braces are the expected frequencies.
Finally substitute the values in the
Step 4: Rejection rule:
Reject
Since
Step 5: Conclusion
Reject the null hypothesis and conclude that proportion of participants who claim to remember broken glass differ significantly from group to group.
b.
To find: The value of Cramer’s V to measure the size of the treatment effect.
Answer to Problem 13P
Explanation of Solution
Calculations:
The formula for Cramer’s V is:
Here,
Substitute 7.77 for
Hence, value of Cramer’s V is 0.227
c.
To describe: How does the phrasing of the question influence the participant’s memories.
Answer to Problem 13P
Explanation of Solution
Cramer’s V is used as post-test to determine strengths of association once the chi-square has determined significance. A value of 0.227 indicates a small effect. That is, a little association between the groups.
d.
Answer to Problem 13P
Explanation of Solution
The result showed that the proportion of participants who claim to remember broken glass differ significantly from group to group.
Want to see more full solutions like this?
Chapter 15 Solutions
LMS Integrated MindTap Psychology, 1 term (6 months) Printed Access Card for Gravetter/Wallnau/Forzano's Essentials of Statistics for the Behavioral Sciences, 9th


- I need help with this problem and an explanation of the solution for the image described below. (Statistics: Engineering Probabilities)arrow_forwardI need help with this problem and an explanation of the solution for the image described below. (Statistics: Engineering Probabilities)arrow_forwardDATA TABLE VALUES Meal Price ($) 22.78 31.90 33.89 22.77 18.04 23.29 35.28 42.38 36.88 38.55 41.68 25.73 34.19 31.75 25.24 26.32 19.57 36.57 32.97 36.83 30.17 37.29 25.37 24.71 28.79 32.83 43.00 35.23 34.76 33.06 27.73 31.89 38.47 39.42 40.72 43.92 36.51 45.25 33.51 29.17 30.54 26.74 37.93arrow_forward
- I need help with this problem and an explanation of the solution for the image described below. (Statistics: Engineering Probabilities)arrow_forwardSales personnel for Skillings Distributors submit weekly reports listing the customer contacts made during the week. A sample of 65 weekly reports showed a sample mean of 19.5 customer contacts per week. The sample standard deviation was 5.2. Provide 90% and 95% confidence intervals for the population mean number of weekly customer contacts for the sales personnel. 90% Confidence interval, to 2 decimals: ( , ) 95% Confidence interval, to 2 decimals:arrow_forwardA simple random sample of 40 items resulted in a sample mean of 25. The population standard deviation is 5. a. What is the standard error of the mean (to 2 decimals)? b. At 95% confidence, what is the margin of error (to 2 decimals)?arrow_forward
- mean trough level of the population to be 3.7 micrograms/mL. The researcher conducts a study among 93 newly diagnosed arthritis patients and finds the mean trough to be 4.1 micrograms/mL with a standard deviation of 2.4 micrograms/mL. The researcher wants to test at the 5% level of significance if the trough is different than previously reported or not. Z statistics will be used. Complete Step 5 of hypothesis testing: Conclusion. State whether or not you would reject the null hypothesis and why. Also interpret what this means (i.e. is the mean trough different from 3.7 or noarrow_forward30% of all college students major in STEM (Science, Technology, Engineering, and Math). If 48 college students are randomly selected, find the probability thata. Exactly 12 of them major in STEM. b. At most 17 of them major in STEM. c. At least 12 of them major in STEM. d. Between 9 and 13 (including 9 and 13) of them major in STEM.arrow_forward7% of all Americans live in poverty. If 40 Americans are randomly selected, find the probability thata. Exactly 4 of them live in poverty. b. At most 1 of them live in poverty. c. At least 1 of them live in poverty. d. Between 2 and 9 (including 2 and 9) of them live in poverty.arrow_forward
- 48% of all violent felons in the prison system are repeat offenders. If 40 violent felons are randomly selected, find the probability that a. Exactly 18 of them are repeat offenders. b. At most 18 of them are repeat offenders. c. At least 18 of them are repeat offenders. d. Between 17 and 21 (including 17 and 21) of them are repeat offenders.arrow_forwardConsider an MA(6) model with θ1 = 0.5, θ2 = −25, θ3 = 0.125, θ4 = −0.0625, θ5 = 0.03125, and θ6 = −0.015625. Find a much simpler model that has nearly the same ψ-weights.arrow_forwardLet {Yt} be an AR(2) process of the special form Yt = φ2Yt − 2 + et. Use first principles to find the range of values of φ2 for which the process is stationary.arrow_forward
 Big Ideas Math A Bridge To Success Algebra 1: Stu...AlgebraISBN:9781680331141Author:HOUGHTON MIFFLIN HARCOURTPublisher:Houghton Mifflin Harcourt
 Glencoe Algebra 1, Student Edition, 9780079039897...AlgebraISBN:9780079039897Author:CarterPublisher:McGraw Hill
 Holt Mcdougal Larson Pre-algebra: Student Edition...AlgebraISBN:9780547587776Author:HOLT MCDOUGALPublisher:HOLT MCDOUGAL
 Functions and Change: A Modeling Approach to Coll...AlgebraISBN:9781337111348Author:Bruce Crauder, Benny Evans, Alan NoellPublisher:Cengage Learning