
Concept explainers
Videos
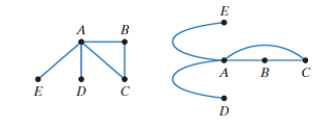
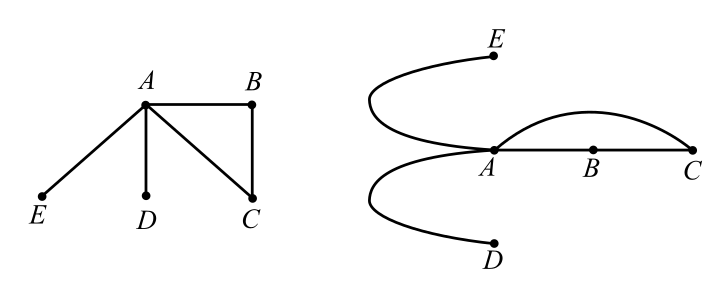
Explain why the two figures show equivalent graphs. Then draw a third equivalent graph.
Answer to Problem 1RE
Solution:
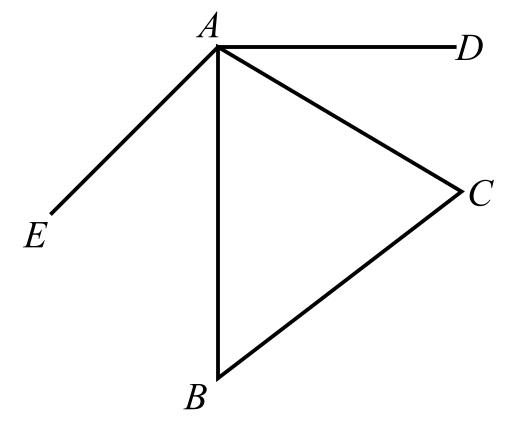
Both the graphs are equivalent and third equivalent graph is;
Explanation of Solution
Given:
Consider the provided graphs;
Explanation:
In both figures, the vertices are A, B, C, D and E. Both graphs have an edge that connects vertex A to vertex B (edge AB or BA ), an edge that connects vertex B to vertex C (edge BC or CB ), an edge that connects vertex A to vertex E (edge AE or EA ), an edge that connects vertex A to vertex C (edge AC or CA ) and an edge that connects vertex A to vertex D (edge AD or DA ). Because the two graphs have the same number of vertices connected to each other in the same way, they are equivalent.
Third equivalent graph is;
Want to see more full solutions like this?
Chapter 14 Solutions
Thinking Mathematically (7th Edition)


- Can you solve it numerical methodarrow_forwardUse the information to find and compare Ay and dy. (Round your answers to four decimal places.) Function x-Value Differential of x Ду = dy = y = x² + 2 x = -4 Ax = dx = 0.01arrow_forwardThe battery temperatures are a major concern for us. Can you analyze and describe the sample data? What are the average and median temperatures? How much variability is there in the temperatures? Is there anything that stands out? Our engineers’ assumption is that the temperature data is normally distributed. If that is the case, what would be the likelihood that the Safety Zone temperature will exceed 5.15 degrees? What is the probability that the Safety Zone temperature will be less than 4.65 degrees? What is the actual percentage of samples that exceed 5.25 degrees or are less than 4.75 degrees? Is the manufacturing process producing units with stable Safety Zone temperatures? Can you check if there are any apparent changes in the temperature pattern? Are there any outliers? A closer look at the Z-scores should help you in this regard.arrow_forward
- Find the values of x and y in the following scalar multiplication. 8 2 x 1 3 || y = 9 LY_ Show Calculatorarrow_forwarda/ Solve the equation Laplac transfors wt = wxx W (X10)=0 w (o,t) = f (t) lim wexit) = 0 *>° t>o , to t70 848arrow_forwardQ/ Find the Fourier sine and cosine trans forms of f(x) = e-cxarrow_forward
- Calculus lll May I please have the statements completed for the following text lines and box? Thank you so much,arrow_forwardCalculus lll May I please have the solution for the following exercise? Thank you so mucharrow_forwardCalculus lll May I please have the solution for the following exercise? Thank you so much,arrow_forward
 Algebra: Structure And Method, Book 1AlgebraISBN:9780395977224Author:Richard G. Brown, Mary P. Dolciani, Robert H. Sorgenfrey, William L. ColePublisher:McDougal Littell
 Glencoe Algebra 1, Student Edition, 9780079039897...AlgebraISBN:9780079039897Author:CarterPublisher:McGraw Hill
 Algebra & Trigonometry with Analytic GeometryAlgebraISBN:9781133382119Author:SwokowskiPublisher:Cengage
 Big Ideas Math A Bridge To Success Algebra 1: Stu...AlgebraISBN:9781680331141Author:HOUGHTON MIFFLIN HARCOURTPublisher:Houghton Mifflin Harcourt
 College Algebra (MindTap Course List)AlgebraISBN:9781305652231Author:R. David Gustafson, Jeff HughesPublisher:Cengage Learning