Rainfall Refer to exercise 13.35, which discussed a study on the effects of cloud seeding to produce rainfall. Some researchers think that cloud seeding has little effect on “low rain potential” clouds. Instead, they claim, most of the action is with clouds that would produce lots of rain even without seeding. In this scenario, clouds that would produce little rain without seeding will produce little rain with seeding. However, the clouds that would produce the most rain without seeding will produce much, much more rain with cloud seeding. To test this, researchers carried out a randomization test to find out whether the third

a. Explain what it means to say that the third quartile of rainfall is 474.30 acre-feet.
b. Why is the third quartile an appropriate statistic to answer the research-ers’ question?
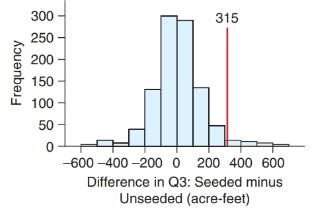
c. What is the observed difference in third-quartile rainfall between the seeded and unseeded clouds?
d. To determine whether such differences could occur by chance, a statistician could have written the 52 rainfall amounts on separate slips of paper and randomly dealt them into two stacks. He or she would then have computed the third quartile of each stack and found the difference. A computer actually did this 1000 times, each time finding the difference between the third quartile for the seeded clouds minus the third quartile for the unseeded clouds. The results are shown in the histogram. Referring to the histogram, carry out a hypothesis test to test whether cloud seeding increased the third-quartile rainfall. (You will have to get approximate

Want to see the full answer?
Check out a sample textbook solution
Chapter 13 Solutions
INTRODUCTORY STATISTICS (LOOSELEAF)
Additional Math Textbook Solutions
Math in Our World
Elementary and Intermediate Algebra: Concepts and Applications (7th Edition)
Elementary Statistics ( 3rd International Edition ) Isbn:9781260092561
Graphical Approach To College Algebra
Probability And Statistical Inference (10th Edition)
APPLIED STAT.IN BUS.+ECONOMICS
- What does the y -intercept on the graph of a logistic equation correspond to for a population modeled by that equation?arrow_forwardPart c of 6.2 only.arrow_forward5. Researchers have recently discovered that penguins like to visit Ottawa in the winter be- cause of the nice weather. At the time the discovery was made, there were 100 penguins visiting. Since then, the researchers have recorded that each day, 10% of the visiting pen- guins leave and 40 more penguins fly in (on Air Canada flights). What DTDS best models the population of visiting penguins? A. P+1 = 0.1P, + 40 B. P+1 = -0.1P, + 40 C. P41 = 0.9P; D. P+1 = 0.9P; + 40 E. P+1 = 0.9P; + 100 F. P+1 = 0.1P, + 100arrow_forward
- Can attack of a plant by one organism induce resistance to subsequent attack by a different organism? In a study of this question, individually potted cotton plants were randomly allocated to two groups. Each plant in one group received an infestation of spider mites; the other group were kept as controls. After 2 weeks the mites were removed, and all plants were inoculated with a fungus that causes wilt disease. According to the research question, H0: Miles do not induce resistance to wilt. Ha: Mites do induce resistance to wilt. What is the alternative hypothesis in symbols when p represents the proportion of wilt disease in a group? p1 < p2 or p1 > p2?arrow_forwardIn his doctoral thesis, L. A. Beckel (University of Minnesota, 1982) studied the social behavior of river otters during the mating season. An important role in the bonding process of river otters is very short periods of social grooming. After extensive observations, Dr. Beckel found that one group of river otters under study had a frequency of initiating grooming of approximately 1.7 for each 10 minutes. Suppose that you are observing river otters for 30 minutes. Let r = 0, 1, 2, ... be a random variable that represents the number of times (in a 30-minute interval) one otter initiates social grooming of another. a) What is ?? b) Write out the formula for the probability distribution of the random variable r. P(r) = _________ c) Find the probability that one otter will initiate social grooming four or more times during the 30-minute observation period. (Round your answer to four decimal places.)arrow_forwardThe mango is considered the "king of fruits" in many parts of the world. Mangoes are generally harvested at the mature green stage and ripen up during the marketing process of transport, storage, and so on. During this process, about 30% of the fruit is wasted. Because of this, the impact of harvest stage and storage conditions on the postharvest quality are of interest. In this experiment, the fruit was harvested at 80, 95, or 110 days after the fruit setting (the transition from flower to fruit) and then stored at temperatures of 20∘C, 30∘C, or 40∘C. For each harvest time and storage temperature, a random sample of mangoes was selected, and the time to ripening was measured. What are the factors, the treatments, and the response variables? Take each item from the answer bank and place into the appropriate category.arrow_forward
- In a large metropolitan area, 15% of the commuters currently use the public transportation system, whereas the remaining 85% commute via automobile. The city has recently revitalized and expanded its public transportation system. It is expected that 6 months from now 10% of those who are now commuting to work via automobile will switch to public transportation, and 90% will continue to commute via automobile. At the same time, it is expected that 20% of those now using public transportation will commute via automobile and 80% will continue to use public transportation. (a) Construct the transition matrix for the Markov chain that describes the change in the mode of transportation used by these commuters. P T = A (b) Find the initial distribution vector for this Markov chain. Xo = (c) What percentage of the commuters are expected to use public transportation 6 months from now? (Round your answer to the nearest percent.)arrow_forwardA medical student at a community college in city Q wants to study the factors affecting the systolic blood pressure of a person (Y). Generally, the systolic blood pressure depends on the BMI of a person (B) and the age of the person A. She wants to test whether or not the BMI has a significant effect on the systolic blood pressure, keeping the age of the person constant. For her study, she collects a random sample of 150 patients from the city and estimates the following regression function: Y= 15.50 +0.90B + 1.10A. (0.48) (0.35) The test statistic of the study the student wants to conduct (Ho: B, =0 vs. H4: B, #0), keeping other variables constant is. (Round your answer to two decimal places.) At the 5% significance level, the student will v the null hypothesis. Keeping BMI constant, she now wants test whether the age of a person (A) has no significant effect or a positive effect on the person's systolic blood pressure. So, the test statistic associated with the one-sided test the…arrow_forwardHalcion is a sleeping pill that is relatively rapidly metabolized by the body and therefore having fewer hangover effects the next morning, compared to other sleeping pills. Opponents of Halcion argue that, because this agent is so rapidly metabolized by the body, patients do not sleep as long with this drug as with Dalmane. Data on 10 insomniacs, each of whom took Dalmane on one occasion and Halcion on a second, is collected. The variable measured is number of hours of sleep: Patient 1 2 3 4 5 6 7 8 9 10 Number of Hours Sleep with Dalmane Halcion 4.58 3.97 5.19 4.88 3.94 4.09 6.32 5.87 7.68 6.93 3.48 4.00 5.72 5.08 7.04 6.95 5.27 4.96 5.84 5.13 Do these data suggest that Halcion is not as effective as Dalmane with respect to number of hours of sleep? Report the p-value of your test below. Round your answer to 3 decimal places (e.g. 0.XXX).arrow_forward
- Dr. Rancur believes that working memory errors (M) will increase linearly with increases in level of cognitive load (CL). He randomly assigns 10 subjects to each of four cognitive load levels: 1, 3, 5 and 7 and assesses subjects’ memory performance. The results of his study are exhaustively summarized below. Using the summary information, carry out an analysis to determine if M is related to CL in the way Dr. Rancur predicts. Make sure you estimate the magnitude of the association, and construct a confidence interval as appropriate. In a summary sentence or two, evaluate the evidence for or against Dr. Rancur’s prediction.arrow_forwardChapter 1, Section 1, Exercise 019 Trans-Generational Effects of EnvironmentWe ask whether experiences of parents can affect future children and describe a study that suggests the answer is yes. A second study, described in the same reference, shows similar effects. Young female mice were assigned to either live for two weeks in an enriched environment or not. Matching what has been seen in other similar experiments, the adult mice who had been exposed to an enriched environment were smarter (in the sense that they learned how to navigate mazes faster) than the mice that did not have that experience. The other interesting result, however, was that the offspring of the mice exposed to the enriched environment were also smarter than the offspring of the other mice, even though none of the offspring were exposed to an enriched environment themselves. One variable is whether or not the young female mice lived in an enriched environment and another variable is how fast the offspring…arrow_forwardA manager of a large supermarket chain wants to predict the demand of the best-selling SKU of the Coke product family, namely the 16 oz 24-can case. The manager thinks that the demand of Coke may be related to its price, the national advertisement expenditure level of Coke, and the price of the 16 oz 24-can case Pepsi Cola. Based on a sample of 20 weeks of data of quantity sold (in cases) for the Coke Cola, price of Coke Cola (in dollars), Coke's advertisement expenditure (in million dollars), and the price of Pepsi Cola (in dollars), a multiple linear regression analysis was performed in Excel. A part of the output of the regression analysis is given below: SUMMARY OUTPUT Regression Statistics Multiple R R Square Adjusted R Square Standard Error Observations ANOVA Regression Residual Total Intercept Price of Coke Ad Expenditure Price of Pepsi 0.70955 0.503461 0.410359 2.130054 20 Df 3 16 19 Coefficients 48.63081 -0.3035 0.342937 0.23406 SS 73.60593 72.59407 146.2 Standard Error…arrow_forward
 Linear Algebra: A Modern IntroductionAlgebraISBN:9781285463247Author:David PoolePublisher:Cengage Learning
 Holt Mcdougal Larson Pre-algebra: Student Edition...AlgebraISBN:9780547587776Author:HOLT MCDOUGALPublisher:HOLT MCDOUGAL
 Glencoe Algebra 1, Student Edition, 9780079039897...AlgebraISBN:9780079039897Author:CarterPublisher:McGraw Hill
 Big Ideas Math A Bridge To Success Algebra 1: Stu...AlgebraISBN:9781680331141Author:HOUGHTON MIFFLIN HARCOURTPublisher:Houghton Mifflin Harcourt


