Concept explainers
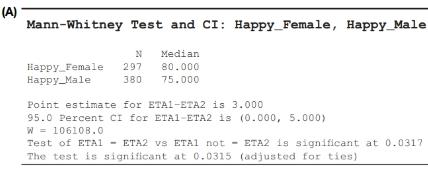
Happiness A StatCrunch survey of happiness measured the happiness level for males and females. Each person selected a number from 1 (lowest) to 100 (highest) to measure her or his level of happiness. Figure A shows the output for a Mann-Whitney test to compare the
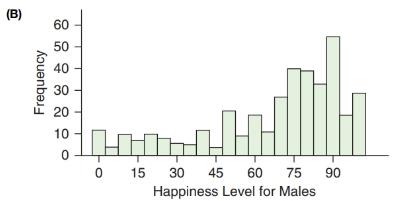
a. Figure B is a histogram of happiness level for the males. Describe the shape of the distribution of the sample, and comment on whether it would be better to compare means or medians and explain.
b. Compare the sample medians descriptively.
c. Assuming we have a random sample of male and female users of Stat-Crunch, test the hypothesis that the typical happiness level (as measured by the median) is different for males and females. Use a significance level of 0.05.


Want to see the full answer?
Check out a sample textbook solution
Chapter 13 Solutions
INTRODUCTORY STATISTICS (LOOSELEAF)
Additional Math Textbook Solutions
Elementary Statistics ( 3rd International Edition ) Isbn:9781260092561
Pathways To Math Literacy (looseleaf)
Elementary and Intermediate Algebra: Concepts and Applications (7th Edition)
College Algebra (7th Edition)
Calculus for Business, Economics, Life Sciences, and Social Sciences (14th Edition)
APPLIED STAT.IN BUS.+ECONOMICS
 Glencoe Algebra 1, Student Edition, 9780079039897...AlgebraISBN:9780079039897Author:CarterPublisher:McGraw Hill
 Holt Mcdougal Larson Pre-algebra: Student Edition...AlgebraISBN:9780547587776Author:HOLT MCDOUGALPublisher:HOLT MCDOUGAL
 Big Ideas Math A Bridge To Success Algebra 1: Stu...AlgebraISBN:9781680331141Author:HOUGHTON MIFFLIN HARCOURTPublisher:Houghton Mifflin Harcourt


