Electric Motor Control
10th Edition
ISBN: 9781133702818
Author: Herman
Publisher: CENGAGE L
expand_more
expand_more
format_list_bulleted
Videos
Textbook Question
Chapter 13, Problem 1SQ
Draw a simple circuit showing how a red pilot light is energized when a limit switch is operated by a moving object.
Expert Solution & Answer
To determine
Draw a simple circuit to show how a red pilot light is energized by a moving object.
Explanation of Solution
Limit switch is a device used to convert mechanical motion into an electrical signal to switch circuits.
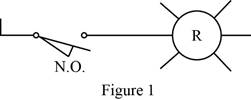
Refer to Figure 1, which shows that the symbol of limit switch is in normally open condition.
When the moving object or moving machine strikes on the operating lever of the limit switch, then the position of the switch becomes normally closed condition. Therefore, the switch gets actuated and the red pilot light is energized.
Conclusion:
Thus, a simple circuit is drawn for a red pilot light by a moving object.
Want to see more full solutions like this?
Subscribe now to access step-by-step solutions to millions of textbook problems written by subject matter experts!
Students have asked these similar questions
Q1/Sketch the root locus for the system shown in Figure 1 and find the following:
a. The exact point and gain where the locus crosses the jo-axis b. The breakaway point
on the real axis c. The range of K within which the system is stable d. Angles of
departure and arrival
R(s) +
K(s²-4s +20)
C(s)
(s+2)(s + 4)
Exam2
Subject: (Numerical Analysis)
Class: Third
Date: 27/4/2025
Time: 60 minutes
Q1. For what values of k does this system of equations has no solution? (use Gauss-Jordan eliminations)
kx + y + z = 1
x+ky + z = 1
x+y+kz=1
Consider the Difference equation of a causal Linear time-invariant (LTI) system given
by: (y(n) - 1.5y(n - 1) + 0.5y(n = 2) = x(n)
a) Implement the difference equation model of this system.
b) Find the system transfer function H(z).
c) For an input x(n) = 8(n), determine the output response y(n).
d) Verify the initial value theorem y(0) with part (c).
Chapter 13 Solutions
Electric Motor Control
Ch. 13 - Draw a simple circuit showing how a red pilot...Ch. 13 - Prob. 2SQCh. 13 - What is the advantage of a photodiode in a...Ch. 13 - What type of photodetector is often used in...Ch. 13 - What do Hall effect sensors detect?Ch. 13 - Hall effect sensors do not depend on...Ch. 13 - Prob. 7SQCh. 13 - Prob. 8SQCh. 13 - Prob. 9SQCh. 13 - How is it possible for the miscroswitch to change...
Knowledge Booster


Learn more about
Need a deep-dive on the concept behind this application? Look no further. Learn more about this topic, electrical-engineering and related others by exploring similar questions and additional content below.Similar questions
- Q5B. Find the type of the controller in the following figures and use real values to find the transfer function of three of them[ Hint Pi,Pd and Lead,lag are found so put the controller with its corresponding compensator]. R₁ R₂ Rz HE C2 RA HE R₁ R2 RA とarrow_forwardQ1// Sketch the root locus for the unity feedback system. Where G(s)=)= K S3+252 +25 and find the following a. Sketch the asymptotes b. The exact point and gain where the locus crosses the jo-axis c. The breakaway point on the real axis d. The range of K within which the system is stable e. Angles of departure and arrival.arrow_forwardDetermine X(w) for the given function shown in Figure (1) by applying the differentiation property of the Fourier Transform. Figure (1) -1 x(t)arrow_forward
- Can you solve a question with a drawing Determine X(w) for the given function shown in Figure (1) by applying the differentiation property of the Fourier Transform. Figure (1) -1 x(t)arrow_forwardAn inductor has a current flow of 3 A when connected to a 240 V, 60 Hz power line. The inductor has a wire resistance of 15 Find the Q of the inductorarrow_forwardصورة من s94850121arrow_forward
- The joint density function of two continuous random variables X and Yis: p(x, y) = {Keós (x + y) Find (i) the constant K 0 2 0arrow_forwardShow all the steps please, Solve for the current through R2 if E2 is replaced by a current source of 10mA using superposition theorem. R5=470Ω R2=1000Ω R6=820Ωarrow_forwardPlease solve it by explaining the steps. I am trying to prepare for my exam tomorrow, so any tips and tricks to solve similar problems are highly appreciated. Plus, this is a past exam I am using to prepare.arrow_forwardPlease solve it by explaining the steps. I am trying to prepare for my exam today, so any tips and tricks to solve similar problems are highly appreciated. Plus, this is a past exam I am using to prepare.arrow_forwardIf C is the circle |z|=4 evaluate f f (z)dz for each of the following functions using residue. 1 f(z) = z(z²+6z+4)arrow_forwardIf C is the circle |z|=4 evaluate ff(z)dz for each of the following functions using residue. f(z) z(z²+6z+4)arrow_forwardarrow_back_iosSEE MORE QUESTIONSarrow_forward_ios
Recommended textbooks for you

 Electricity for Refrigeration, Heating, and Air C...Mechanical EngineeringISBN:9781337399128Author:Russell E. SmithPublisher:Cengage Learning
 EBK ELECTRICAL WIRING RESIDENTIALElectrical EngineeringISBN:9781337516549Author:SimmonsPublisher:CENGAGE LEARNING - CONSIGNMENT
Electricity for Refrigeration, Heating, and Air C...
Mechanical Engineering
ISBN:9781337399128
Author:Russell E. Smith
Publisher:Cengage Learning
EBK ELECTRICAL WIRING RESIDENTIAL
Electrical Engineering
ISBN:9781337516549
Author:Simmons
Publisher:CENGAGE LEARNING - CONSIGNMENT
Pressure Sensors with Display; Author: Balluff Worldwide;https://www.youtube.com/watch?v=HqAV2xjCLxE;License: Standard Youtube License