
Videos
For the preceding problem you should find that there are significant differences among the three treatments. One reason for the significance is that the sample variances are relatively small. To create the following data, we kept the same sample means that appeared in problem 19 but doubled the SS values within each sample.
- a. Calculate the sample variance for each of the three samples. Describe how these sample variances compare with those from problem 19.
- b. Predict how the increase in sample variance should influence the outcome of the analysis. That is, how will the F-ratio for these data compare with the value obtained m problem 19?
- c. Use an A VOVA with α – .05 to determine whether there are any significant differences among the three treatment means. (Does your answer agree with your prediction in purl b?)
a.
To compare: Obtained sample variances with sample variances from problem 19.
Answer to Problem 20P
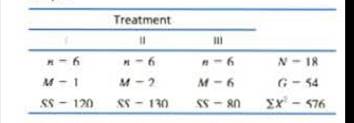
Sample variances for treatment 1, treatment 2, and treatment 3 are 24, 26 and 16 respectively. Obtained sample variance for each treatment are twice of the sample variance in problem 19.
Explanation of Solution
Given info:
The following values are from an independent-measures study comparing three treatment conditions.
| Treatment | |||
| I | II | III | |
|
|
|
|
|
|
|
|
|
|
|
|
|
|
|
Calculation:
Let k represents the numbers of treatments. Then,
For treatment 1
Let
For treatment 2
Let
For treatment 3
Let
The sample variances for treatment I, treatment II and treatment III in problem 19 are 12, 13 and 8 respectively. But sample variances for all treatments in this problem are twice of sample variances in problem 19.
Conclusion:
Sample variances for treatment 1, treatment 2, and treatment 3 are 24, 26 and 16 respectively. Obtained sample variance for each treatment are twice of the sample variance in problem 19.
b.
To predict: The outcome of the analysis.
Answer to Problem 20P
The size of the F-ratio decreases and there are fewer chances to reject the null hypothesis.
Explanation of Solution
From part a. sample variance for each treatment are twice of the sample variances in problem 19.
The formula for F ratio is:
F-ratio is inversely proportional to the mean sum of squares within treatments. So, large sample variances give large mean sum of squares within treatments and hence small value of F-ratio. Therefore, on increasing the size of sample variances, the size of F-ratio would decreases. So, when sample variances increases, chances to reject the null hypothesis decreases.
Conclusion:
The size of the F-ratio decreases and there are fewer chances to reject the null hypothesis.
c.
Answer to Problem 20P
There are no significant mean differences between the three treatments.
Explanation of Solution
Calculation:
Let k represents the numbers of treatments. Then,
Then, degrees of freedom corresponding to
Then, degrees of freedom corresponding to
Total sum of squares is given as:
Sum of squares between treatments is given as:
F-ratio is calculated as:
From the table
Since, F-ratio is less than the critical value; therefore, we fail to reject the null hypothesis and conclude that there are no significant mean differences between the treatments.
Conclusion:
There are no significant mean differences between the treatments. Also, the answer agree with prediction in part b.
Want to see more full solutions like this?
Chapter 12 Solutions
Mindtap Psychology, 1 Term (6 Months) Printed Access Card, Enhanced For Gravetter/wallnau/forzano's Essentials Of Statistics For The Behavioral Sciences


- 30% of all college students major in STEM (Science, Technology, Engineering, and Math). If 48 college students are randomly selected, find the probability thata. Exactly 12 of them major in STEM. b. At most 17 of them major in STEM. c. At least 12 of them major in STEM. d. Between 9 and 13 (including 9 and 13) of them major in STEM.arrow_forward7% of all Americans live in poverty. If 40 Americans are randomly selected, find the probability thata. Exactly 4 of them live in poverty. b. At most 1 of them live in poverty. c. At least 1 of them live in poverty. d. Between 2 and 9 (including 2 and 9) of them live in poverty.arrow_forward48% of all violent felons in the prison system are repeat offenders. If 40 violent felons are randomly selected, find the probability that a. Exactly 18 of them are repeat offenders. b. At most 18 of them are repeat offenders. c. At least 18 of them are repeat offenders. d. Between 17 and 21 (including 17 and 21) of them are repeat offenders.arrow_forward
- Consider an MA(6) model with θ1 = 0.5, θ2 = −25, θ3 = 0.125, θ4 = −0.0625, θ5 = 0.03125, and θ6 = −0.015625. Find a much simpler model that has nearly the same ψ-weights.arrow_forwardLet {Yt} be an AR(2) process of the special form Yt = φ2Yt − 2 + et. Use first principles to find the range of values of φ2 for which the process is stationary.arrow_forwardDescribe the important characteristics of the autocorrelation function for the following models: (a) MA(1), (b) MA(2), (c) AR(1), (d) AR(2), and (e) ARMA(1,1).arrow_forward
- « CENGAGE MINDTAP Quiz: Chapter 38 Assignment: Quiz: Chapter 38 ips Questions ra1kw08h_ch38.15m 13. 14. 15. O Which sentence has modifiers in the correct place? O a. When called, she for a medical emergency responds quickly. b. Without giving away too much of the plot, Helena described the heroine's actions in the film. O c. Nearly the snakebite victim died before the proper antitoxin was injected. . O O 16 16. O 17. 18. O 19. O 20 20. 21 21. 22. 22 DS 23. 23 24. 25. O O Oarrow_forwardQuestions ra1kw08h_ch36.14m 12. 13. 14. 15. 16. Ӧ 17. 18. 19. OS 20. Two separate sentences need Oa. two separate subjects. Ob. two dependent clauses. c. one shared subject.arrow_forwardCustomers experiencing technical difficulty with their Internet cable service may call an 800 number for technical support. It takes the technician between 30 seconds and 11 minutes to resolve the problem. The distribution of this support time follows the uniform distribution. Required: a. What are the values for a and b in minutes? Note: Do not round your intermediate calculations. Round your answers to 1 decimal place. b-1. What is the mean time to resolve the problem? b-2. What is the standard deviation of the time? c. What percent of the problems take more than 5 minutes to resolve? d. Suppose we wish to find the middle 50% of the problem-solving times. What are the end points of these two times?arrow_forward
- Exercise 6-6 (Algo) (LO6-3) The director of admissions at Kinzua University in Nova Scotia estimated the distribution of student admissions for the fall semester on the basis of past experience. Admissions Probability 1,100 0.5 1,400 0.4 1,300 0.1 Click here for the Excel Data File Required: What is the expected number of admissions for the fall semester? Compute the variance and the standard deviation of the number of admissions. Note: Round your standard deviation to 2 decimal places.arrow_forward1. Find the mean of the x-values (x-bar) and the mean of the y-values (y-bar) and write/label each here: 2. Label the second row in the table using proper notation; then, complete the table. In the fifth and sixth columns, show the 'products' of what you're multiplying, as well as the answers. X y x minus x-bar y minus y-bar (x minus x-bar)(y minus y-bar) (x minus x-bar)^2 xy 16 20 34 4-2 5 2 3. Write the sums that represents Sxx and Sxy in the table, at the bottom of their respective columns. 4. Find the slope of the Regression line: bi = (simplify your answer) 5. Find the y-intercept of the Regression line, and then write the equation of the Regression line. Show your work. Then, BOX your final answer. Express your line as "y-hat equals...arrow_forwardApply STATA commands & submit the output for each question only when indicated below i. Generate the log of birthweight and family income of children. Name these new variables Ibwght & Ifaminc. Include the output of this code. ii. Apply the command sum with the detail option to the variable faminc. Note: you should find the 25th percentile value, the 50th percentile and the 75th percentile value of faminc from the output - you will need it to answer the next question Include the output of this code. iii. iv. Use the output from part ii of this question to Generate a variable called "high_faminc" that takes a value 1 if faminc is less than or equal to the 25th percentile, it takes the value 2 if faminc is greater than 25th percentile but less than or equal to the 50th percentile, it takes the value 3 if faminc is greater than 50th percentile but less than or equal to the 75th percentile, it takes the value 4 if faminc is greater than the 75th percentile. Include the outcome of this code…arrow_forward
 Glencoe Algebra 1, Student Edition, 9780079039897...AlgebraISBN:9780079039897Author:CarterPublisher:McGraw Hill
 Big Ideas Math A Bridge To Success Algebra 1: Stu...AlgebraISBN:9781680331141Author:HOUGHTON MIFFLIN HARCOURTPublisher:Houghton Mifflin Harcourt
 Functions and Change: A Modeling Approach to Coll...AlgebraISBN:9781337111348Author:Bruce Crauder, Benny Evans, Alan NoellPublisher:Cengage Learning
 Linear Algebra: A Modern IntroductionAlgebraISBN:9781285463247Author:David PoolePublisher:Cengage Learning