
Videos
Steele Electric Products Inc. assembles cell phones. For the last 10 days, Mark Nagy completed a mean of 39 phones per day, with a standard deviation of 2 per day. Debbie Richmond completed a mean of 38.5 phones per day, with a standard deviation of 1.5 per day. At the .05 significance level, can we conclude that there is more variation in Mark’s daily production?
Find whether there is more variation in Person M’s daily production.
Answer to Problem 1SR
There is no more variation in Person M’s daily production.
Explanation of Solution
Here,
The null and alternative hypotheses are stated below:
That is, the variation in Person M’s daily production is less than or equal to the variation in Person R’s production.
That is, the variation in Person M’s daily production is more than that of Person R’s production.
Step-by-step procedure to obtain the test statistic using MINITAB software:
- Choose Stat > Basic Statistics > 2 Variance.
- Under Data, choose Sample standard deviation.
- In First, enter 10 under Sample size.
- In First, enter 2 under Standard deviation
- In Second, enter 10 under Sample size.
- In Second, enter 1.5 under Standard deviation
- Check Options, enter Confidence level as 95.0.
- In Hypothesized ratio StDev 1 / StDev 2
- Choose greater than in alternative.
- Click OK in all dialog boxes.
- Output obtained using MINITAB is represented as follows:
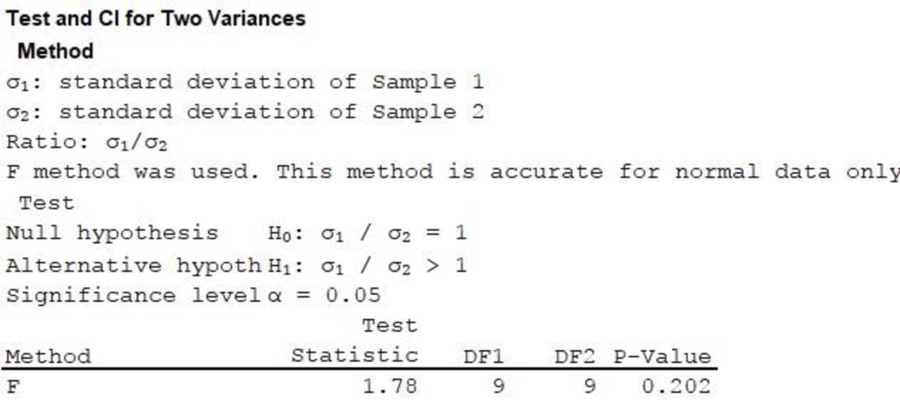
- From the above output, the F test statistic value is 1.78 and the p-value is 0.202.
Decision Rule:
If the p-value is less than the level of significance, reject the null hypothesis. Otherwise, fail to reject the null hypothesis.
Conclusion:
The level of significance is 0.05.
From the output, the p-value is 0.202.
The p-value is greater than the level of significance 0.05. Hence, one is failed to reject the null hypothesis at the 0.05 significance level.
Therefore, there is no more variation in Person M’s daily production.
Want to see more full solutions like this?
Chapter 12 Solutions
EBK STATISTICAL TECHNIQUES IN BUSINESS


- A company found that the daily sales revenue of its flagship product follows a normal distribution with a mean of $4500 and a standard deviation of $450. The company defines a "high-sales day" that is, any day with sales exceeding $4800. please provide a step by step on how to get the answers in excel Q: What percentage of days can the company expect to have "high-sales days" or sales greater than $4800? Q: What is the sales revenue threshold for the bottom 10% of days? (please note that 10% refers to the probability/area under bell curve towards the lower tail of bell curve) Provide answers in the yellow cellsarrow_forwardFind the critical value for a left-tailed test using the F distribution with a 0.025, degrees of freedom in the numerator=12, and degrees of freedom in the denominator = 50. A portion of the table of critical values of the F-distribution is provided. Click the icon to view the partial table of critical values of the F-distribution. What is the critical value? (Round to two decimal places as needed.)arrow_forwardA retail store manager claims that the average daily sales of the store are $1,500. You aim to test whether the actual average daily sales differ significantly from this claimed value. You can provide your answer by inserting a text box and the answer must include: Null hypothesis, Alternative hypothesis, Show answer (output table/summary table), and Conclusion based on the P value. Showing the calculation is a must. If calculation is missing,so please provide a step by step on the answers Numerical answers in the yellow cellsarrow_forward
 Glencoe Algebra 1, Student Edition, 9780079039897...AlgebraISBN:9780079039897Author:CarterPublisher:McGraw Hill